Jabil Inc. (JBL): Price and Financial Metrics
JBL Price/Volume Stats
Current price | $124.18 | 52-week high | $156.94 |
Prev. close | $123.15 | 52-week low | $75.48 |
Day low | $122.83 | Volume | 2,724,500 |
Day high | $126.50 | Avg. volume | 1,413,987 |
50-day MA | $135.25 | Dividend yield | 0.22% |
200-day MA | $120.77 | Market Cap | 15.84B |
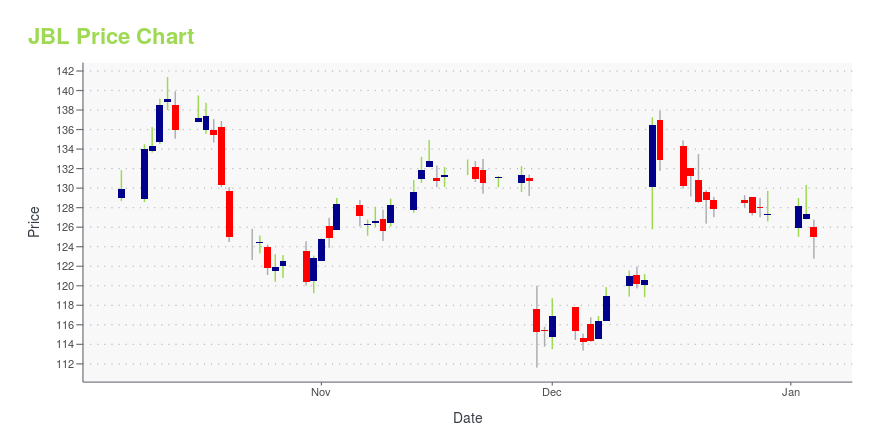
JBL Stock Price Chart Interactive Chart >
JBL POWR Grades
- JBL scores best on the Momentum dimension, with a Momentum rank ahead of 90.86% of US stocks.
- The strongest trend for JBL is in Stability, which has been heading down over the past 26 weeks.
- JBL ranks lowest in Sentiment; there it ranks in the 14th percentile.
JBL Stock Summary
- JBL has a market capitalization of $16,293,803,900 -- more than approximately 87.44% of US stocks.
- JABIL INC's capital turnover -- a measure of revenue relative to shareholder's equity -- is better than 96.85% of US listed stocks.
- With a one year PEG ratio of 320.09, JABIL INC is expected to have a higher PEG ratio (a measure of how expensive a stock is relative to its expected earnings growth) than 89.68% of US stocks.
- Stocks with similar financial metrics, market capitalization, and price volatility to JABIL INC are MOH, BURL, GFF, TSCO, and KD.
- Visit JBL's SEC page to see the company's official filings. To visit the company's web site, go to www.jabil.com.
JBL Valuation Summary
- In comparison to the median Technology stock, JBL's price/earnings ratio is 30.21% lower, now standing at 18.6.
- JBL's EV/EBIT ratio has moved down 84.4 over the prior 243 months.
Below are key valuation metrics over time for JBL.
Stock | Date | P/S | P/B | P/E | EV/EBIT |
---|---|---|---|---|---|
JBL | 2023-12-08 | 0.4 | 5.3 | 18.6 | 11.4 |
JBL | 2023-12-07 | 0.4 | 5.2 | 18.2 | 11.1 |
JBL | 2023-12-06 | 0.4 | 5.1 | 17.9 | 11.0 |
JBL | 2023-12-05 | 0.4 | 5.1 | 17.9 | 10.9 |
JBL | 2023-12-04 | 0.4 | 5.1 | 18.0 | 11.0 |
JBL | 2023-12-01 | 0.4 | 5.2 | 18.3 | 11.2 |
JBL Growth Metrics
- Its 2 year price growth rate is now at 170.22%.
- Its 5 year price growth rate is now at -18.32%.
- Its 5 year revenue growth rate is now at 44%.
The table below shows JBL's growth in key financial areas (numbers in millions of US dollars).
Date | Revenue | Operating Cash Flow | Net Income to Common Stock |
---|---|---|---|
2022-12-31 | 34,546 | 1,863 | 978 |
2022-09-30 | 33,478 | 1,651 | 996 |
2022-06-30 | 31,857.28 | 1,507.14 | 855.424 |
2022-03-31 | 30,743.92 | 1,547.055 | 806.904 |
2021-12-31 | 30,019.47 | 1,321.54 | 736.558 |
2021-09-30 | 29,285 | 1,433 | 696 |
JBL's Quality Factors
The “Quality” component of the POWR Ratings focuses on 31 different factors of a companies fundamentals and operational strength. Here are some key insights as we drill into the specifics of these quality attributes.- JBL has a Quality Grade of B, ranking ahead of 79.2% of graded US stocks.
- JBL's asset turnover comes in at 1.885 -- ranking 6th of 208 Electronic Equipment stocks.
- AOSL, MCHP, and MOSY are the stocks whose asset turnover ratios are most correlated with JBL.
The table below shows JBL's key quality metrics over time.
Period | Asset Turnover | Gross Margin | ROIC |
---|---|---|---|
2021-08-31 | 1.885 | 0.081 | 0.155 |
2021-05-31 | 1.948 | 0.078 | 0.142 |
2021-02-28 | 1.967 | 0.076 | 0.119 |
2020-11-30 | 1.964 | 0.073 | 0.096 |
2020-08-31 | 1.970 | 0.071 | 0.071 |
2020-05-31 | 1.968 | 0.073 | 0.074 |
JBL Price Target
For more insight on analysts targets of JBL, see our JBL price target page. And for a list of of all stocks sorted by upside potential based on analyst target price, see our Top Price Target page.
Average Price Target | $74.00 | Average Broker Recommendation | 1.22 (Strong Buy) |
Jabil Inc. (JBL) Company Bio
Jabil Circuit provides comprehensive electronics design and manufacturing product management services to global electronics and technology companies. The company was founded in 1966 and is based in St. Petersburg, Florida.
Latest JBL News From Around the Web
Below are the latest news stories about JABIL INC that investors may wish to consider to help them evaluate JBL as an investment opportunity.
Jabil, Inc. (JBL) Is a Trending Stock: Facts to Know Before Betting on ItRecently, Zacks.com users have been paying close attention to Jabil (JBL). This makes it worthwhile to examine what the stock has in store. |
Should iShares Core S&P Mid-Cap ETF (IJH) Be on Your Investing Radar?Style Box ETF report for IJH |
Jabil Inc.'s (NYSE:JBL) Intrinsic Value Is Potentially 62% Above Its Share PriceKey Insights The projected fair value for Jabil is US$209 based on 2 Stage Free Cash Flow to Equity Jabil is estimated... |
Should Vanguard S&P Mid-Cap 400 Value ETF (IVOV) Be on Your Investing Radar?Style Box ETF report for IVOV |
Jabil Inc. (NYSE:JBL) Q1 2024 Earnings Call TranscriptJabil Inc. (NYSE:JBL) Q1 2024 Earnings Call Transcript December 14, 2023 Jabil Inc. beats earnings expectations. Reported EPS is $2.6, expectations were $2.54. Operator: Hello, and welcome to the Jabil First Quarter Fiscal Year 2024 Earnings Conference Call and Webcast. [Operator Instructions] A question-and-answer session will follow the formal presentation. [Operator Instructions] As a reminder, […] |
JBL Price Returns
1-mo | -10.34% |
3-mo | -3.37% |
6-mo | 17.99% |
1-year | 53.57% |
3-year | 146.51% |
5-year | 365.23% |
YTD | -2.47% |
2023 | 87.43% |
2022 | -2.55% |
2021 | 66.40% |
2020 | 3.89% |
2019 | 68.49% |
JBL Dividends
Ex-Dividend Date | Type | Payout Amount | Change | ||||||
---|---|---|---|---|---|---|---|---|---|
Loading, please wait... |
Continue Researching JBL
Want to see what other sources are saying about Jabil Inc's financials and stock price? Try the links below:Jabil Inc (JBL) Stock Price | Nasdaq
Jabil Inc (JBL) Stock Quote, History and News - Yahoo Finance
Jabil Inc (JBL) Stock Price and Basic Information | MarketWatch
Loading social stream, please wait...