
Kellogg Co. (K): Price and Financial Metrics
K Price/Volume Stats
| Current price | $57.47 | 52-week high | $67.81 |
| Prev. close | $57.28 | 52-week low | $47.63 |
| Day low | $57.06 | Volume | 1,805,252 |
| Day high | $57.62 | Avg. volume | 2,778,515 |
| 50-day MA | $58.64 | Dividend yield | 3.96% |
| 200-day MA | $55.71 | Market Cap | 19.65B |
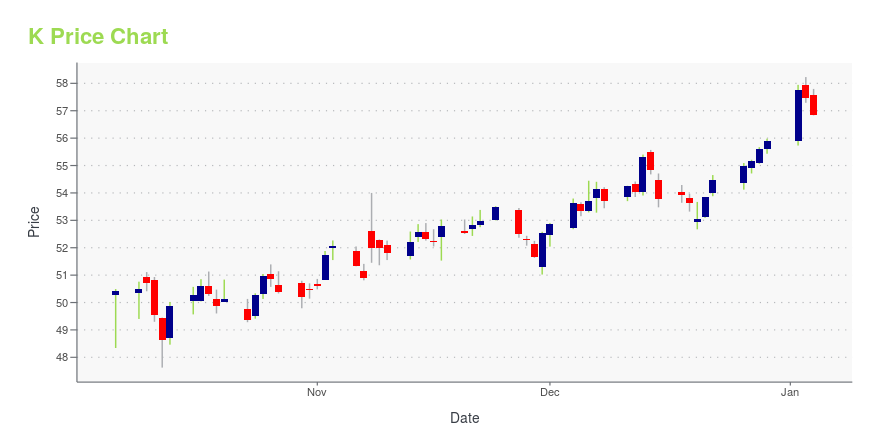
K Stock Price Chart Interactive Chart >
Kellogg Co. (K) Company Bio
The Kellogg Company, doing business as Kellogg's, is an American multinational food manufacturing company headquartered in Battle Creek, Michigan, United States. Kellogg's produces cereal and convenience foods, including crackers and toaster pastries, and markets their products by several well known brands including Corn Flakes, Rice Krispies, Frosted Flakes, Pringles, Eggo, and Cheez-It. Kellogg's mission statement is "Nourishing families so they can flourish and thrive." (Source:Wikipedia)
Latest K News From Around the Web
Below are the latest news stories about KELLANOVA that investors may wish to consider to help them evaluate K as an investment opportunity.
While institutions own 43% of WK Kellogg Co (NYSE:KLG), retail investors are its largest shareholders with 56% ownershipKey Insights WK Kellogg Co's significant retail investors ownership suggests that the key decisions are influenced by... |
We're more alike than we think; Two Pringles® flavors come out on top globallyA recent review of top-selling Pringles flavors in every corner of the globe shows that people can agree on two things: Original and Sour Cream & Onion Pringles. |
WK Kellogg Co to keep Michigan plant, avoiding layoffsAfter previously planning to move its Battle Creek plant’s operations to Canada, the company chose to stay in “Cereal City” after it was given a $5 million grant from the state. |
Kellanova launches Cheez-It® Snap'd®, Cheez-It® Puff'd® and Club® Crisps with reduced plastic packagingKellanova envisions a day where the planet thrives. Three popular snack brands, Cheez-It® Snap'd®, Cheez-It® Puff'd® and Club® Crisps, have reduced the amount of plastic used in their packaging (compared to the same volume last year), while maintaining the same amount of delicious food in each package. The packaging designs were optimized, reducing the total material weight for these three foods by 672,000 pounds, reducing 124,000 pounds of plastic and reducing 548,000 pounds of corrugated cardb |
Northwestern Kellogg MBAs Join The $200K Starting Pay ClubKellogg School of Management has released more detailed MBA Class of 2023 employment numbers showing declines in job offers and acceptances three months after graduation, much the same as every other top U.S. ... The post Northwestern Kellogg MBAs Join The $200K Starting Pay Club appeared first on Poets&Quants. |
K Price Returns
| 1-mo | 0.16% |
| 3-mo | 0.48% |
| 6-mo | 7.04% |
| 1-year | -5.04% |
| 3-year | 7.27% |
| 5-year | 25.05% |
| YTD | 4.80% |
| 2023 | -13.09% |
| 2022 | 14.35% |
| 2021 | 7.44% |
| 2020 | -6.78% |
| 2019 | 26.08% |
K Dividends
| Ex-Dividend Date | Type | Payout Amount | Change | ||||||
|---|---|---|---|---|---|---|---|---|---|
| Loading, please wait... | |||||||||
Continue Researching K
Want to do more research on Kellogg Co's stock and its price? Try the links below:Kellogg Co (K) Stock Price | Nasdaq
Kellogg Co (K) Stock Quote, History and News - Yahoo Finance
Kellogg Co (K) Stock Price and Basic Information | MarketWatch
Loading social stream, please wait...