Kimball Electronics, Inc. (KE): Price and Financial Metrics
KE Stock Summary
- With a one year PEG ratio of 199.02, Kimball Electronics Inc is expected to have a higher PEG ratio (a measure of how expensive a stock is relative to its expected earnings growth) than 84.05% of US stocks.
- With a price/sales ratio of 0.49, Kimball Electronics Inc has a higher such ratio than just 10.5% of stocks in our set.
- With a year-over-year growth in debt of -27.92%, Kimball Electronics Inc's debt growth rate surpasses merely 12.47% of about US stocks.
- If you're looking for stocks that are quantitatively similar to Kimball Electronics Inc, a group of peers worth examining would be PRPO, BHE, NR, WETF, and MBUU.
- KE's SEC filings can be seen here. And to visit Kimball Electronics Inc's official web site, go to www.kimballelectronics.com.
KE Stock Price Chart Interactive Chart >
KE Price/Volume Stats
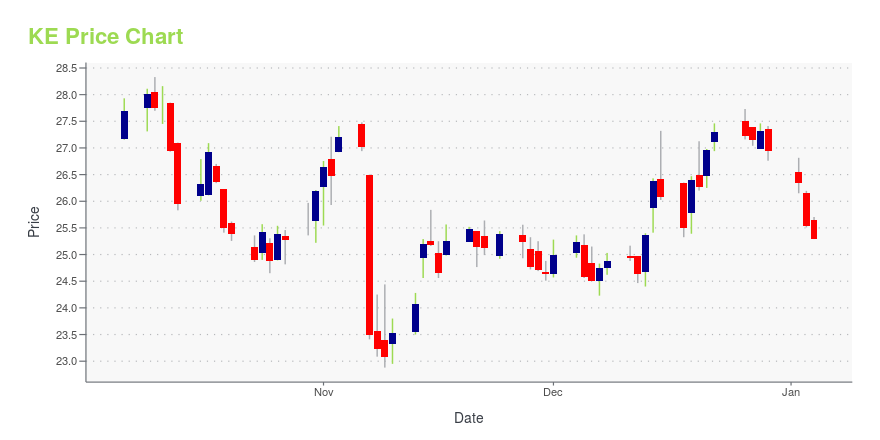
Current price | $24.20 | 52-week high | $25.41 |
Prev. close | $24.89 | 52-week low | $9.78 |
Day low | $24.02 | Volume | 189,500 |
Day high | $24.81 | Avg. volume | 144,564 |
50-day MA | $20.30 | Dividend yield | N/A |
200-day MA | $15.25 | Market Cap | 603.96M |
Kimball Electronics, Inc. (KE) Company Bio
Kimball Electronics provides contract electronics engineering, manufacturing, and supply chain services to customers in the automotive, medical, industrial, and public safety industries in the United States, Poland, and internationally. The company was founded in 1961 and is based in Jasper, Indiana.
KE Price Forecast Based on DCF Valuation
Current Price | DCF Fair Value Target: | Forecasted Gain: |
$24.20 | $1015.15 | 4104% |
We started the process of determining a valid price forecast for Kimball Electronics Inc with a discounted cash flow analysis -- the results of which can be found in the table below. To summarize, we found that Kimball Electronics Inc ranked in the 96th percentile in terms of potential gain offered. Specifically, our DCF analysis implies the stock is trading below its fair value by an estimated 4124.17%. As for the metrics that stood out in our discounted cash flow analysis of Kimball Electronics Inc, consider:
- Interest coverage, a measure of earnings relative to interest payments, is 14.17 -- which is good for besting 80.64% of its peer stocks (US stocks in the Industrials sector with positive cash flow).
- Its compound free cash flow growth rate, as measured over the past 5.01 years, is 1.16% -- higher than 91.91% of stocks in our DCF forecasting set.
- KE's estimated cost of debt, based largely on its market capitalization and its interest coverage ratio, is 3%; for context, that number is higher than 28.47% of tickers in our DCF set.
Terminal Growth Rate in Free Cash Flow | Return Relative to Current Share Price |
0% | 4021% |
1% | 4062% |
2% | 4104% |
3% | 4145% |
4% | 4186% |
5% | 4227% |
BBCP, PRIM, GOL, SRT, and R can be thought of as valuation peers to KE, in the sense that they are in the Industrials sector and have a similar price forecast based on DCF valuation.
Latest KE News From Around the Web
Below are the latest news stories about Kimball Electronics Inc that investors may wish to consider to help them evaluate KE as an investment opportunity.
Price Over Earnings Overview: Kimball ElectronicsIn the current session, Kimball Electronics Inc. (NASDAQ:KE) is trading at $24.54, after a 4.51% gain. Over the past month, the stock increased by 24.19%, and in the past year, by 83.55%. With performance like this, long-term shareholders optimistic but others are more likely to look into the price-to-earnings ratio to see if the stock might be overvalued. Assuming that all other factors are held constant, this could present itself as an opportunity for shareholders trying to capitalize on the higher share price. The stock is currently under from its 52 week high by 3.42%. The P/E ratio is used by long-term shareholders to assess the company's market performance against aggregate market data, historical earnings, and the industry at large. A lower P/E indicates that shareholders do not ... |
What Percentage Of Kimball Electronics, Inc. (NASDAQ:KE) Shares Do Insiders Own?If you want to know who really controls Kimball Electronics, Inc. ( NASDAQ:KE ), then you'll have to look at the makeup... |
Kimball Electronics, Inc.'s (KE) CEO Don Charron on Q2 2021 Results - Earnings Call TranscriptKimball Electronics, Inc. (KE) Q2 2021 Earnings Conference Call February 4, 2021 10:00 am ET Company Participants Don Charron - Chairman of the Board and Chief Executive Officer Mike Sergesketter - Vice President and Chief Financial Officer Conference Call Participants Mike Morales - Walthausen Company Anja Soderstrom - Sidoti Hendi... |
Kimball Electronics, Inc. to Host Earnings CallNEW YORK, NY / ACCESSWIRE / February 4, 2021 / Kimball Electronics, Inc. (NASDAQ:KE) will be discussing their earnings results in their 2021 Second Quarter Earnings call to be held on February 4, 2021 at 10:00 AM Eastern Time. |
Kimball Electronics EPS beats by $0.26, beats on revenueKimball Electronics (KE): Q2 GAAP EPS of $0.60 beats by $0.26.Revenue of $320.6M (+4.4% Y/Y) beats by $12.6M.Press Release... |
KE Price Returns
1-mo | 22.41% |
3-mo | 53.36% |
6-mo | 77.42% |
1-year | 85.30% |
3-year | 41.52% |
5-year | 108.08% |
YTD | 51.34% |
2020 | -8.89% |
2019 | 13.30% |
2018 | -15.12% |
2017 | 0.27% |
2016 | 65.61% |
Continue Researching KE
Want to do more research on Kimball Electronics Inc's stock and its price? Try the links below:Kimball Electronics Inc (KE) Stock Price | Nasdaq
Kimball Electronics Inc (KE) Stock Quote, History and News - Yahoo Finance
Kimball Electronics Inc (KE) Stock Price and Basic Information | MarketWatch
Get Free Updates
Join thousands of investors who get the latest news, insights and top rated picks from StockNews.com!
Loading social stream, please wait...