
Kimco Realty Corp. (KIM): Price and Financial Metrics
KIM Price/Volume Stats
| Current price | $20.93 | 52-week high | $25.83 |
| Prev. close | $21.01 | 52-week low | $17.57 |
| Day low | $20.70 | Volume | 2,520,453 |
| Day high | $21.12 | Avg. volume | 4,828,530 |
| 50-day MA | $21.77 | Dividend yield | 4.71% |
| 200-day MA | $22.48 | Market Cap | 14.22B |
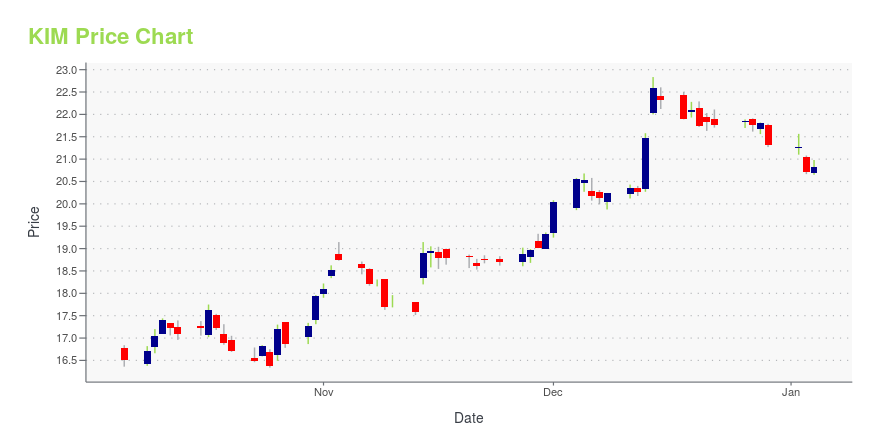
KIM Stock Price Chart Interactive Chart >
Kimco Realty Corp. (KIM) Company Bio
Kimco Realty Corporation is a real estate investment trust that invests in shopping centers. As of March 31, 2022, the company owned interests in 537 U.S. shopping centers and mixed-use assets comprising 93 million square feet of gross leasable space. (Source:Wikipedia)
KIM Price Returns
| 1-mo | -2.32% |
| 3-mo | -9.39% |
| 6-mo | -6.85% |
| 1-year | 11.59% |
| 3-year | -5.18% |
| 5-year | 152.43% |
| YTD | -9.62% |
| 2024 | 15.02% |
| 2023 | 6.05% |
| 2022 | -10.80% |
| 2021 | 69.48% |
| 2020 | -23.94% |
KIM Dividends
| Ex-Dividend Date | Type | Payout Amount | Change | ||||||
|---|---|---|---|---|---|---|---|---|---|
| Loading, please wait... | |||||||||
Continue Researching KIM
Want to see what other sources are saying about Kimco Realty Corp's financials and stock price? Try the links below:Kimco Realty Corp (KIM) Stock Price | Nasdaq
Kimco Realty Corp (KIM) Stock Quote, History and News - Yahoo Finance
Kimco Realty Corp (KIM) Stock Price and Basic Information | MarketWatch
Loading social stream, please wait...