Kimco Realty Corp. (KIM): Price and Financial Metrics
GET POWR RATINGS... FREE!
KIM POWR Grades
- KIM scores best on the Momentum dimension, with a Momentum rank ahead of 56.69% of US stocks.
- The strongest trend for KIM is in Stability, which has been heading up over the past 178 days.
- KIM's current lowest rank is in the Growth metric (where it is better than 17.92% of US stocks).
KIM Stock Summary
- With a price/earnings ratio of 108.49, KIMCO REALTY CORP P/E ratio is greater than that of about 95.51% of stocks in our set with positive earnings.
- Of note is the ratio of KIMCO REALTY CORP's sales and general administrative expense to its total operating expenses; merely 7.54% of US stocks have a lower such ratio.
- For KIM, its debt to operating expenses ratio is greater than that reported by 93.29% of US equities we're observing.
- Stocks with similar financial metrics, market capitalization, and price volatility to KIMCO REALTY CORP are ADC, WPC, REG, BDN, and HPP.
- KIM's SEC filings can be seen here. And to visit KIMCO REALTY CORP's official web site, go to www.kimcorealty.com.
KIM Valuation Summary
- KIM's EV/EBIT ratio is 45.8; this is 68.38% higher than that of the median Real Estate stock.
- KIM's price/earnings ratio has moved up 98.9 over the prior 243 months.
Below are key valuation metrics over time for KIM.
Stock | Date | P/S | P/B | P/E | EV/EBIT |
---|---|---|---|---|---|
KIM | 2023-03-10 | 6.7 | 1.2 | 115.3 | 45.8 |
KIM | 2023-03-09 | 7.0 | 1.3 | 120.2 | 47.0 |
KIM | 2023-03-08 | 7.2 | 1.3 | 122.8 | 47.6 |
KIM | 2023-03-07 | 7.1 | 1.3 | 121.0 | 47.2 |
KIM | 2023-03-06 | 7.3 | 1.3 | 125.7 | 48.3 |
KIM | 2023-03-03 | 7.4 | 1.3 | 126.8 | 48.6 |
KIM Growth Metrics
- Its 2 year net income to common stockholders growth rate is now at 185.01%.
- Its 5 year net cashflow from operations growth rate is now at -4.67%.
- The 5 year revenue growth rate now stands at -1.16%.

The table below shows KIM's growth in key financial areas (numbers in millions of US dollars).
Date | Revenue | Operating Cash Flow | Net Income to Common Stock |
---|---|---|---|
2022-12-31 | 1,727.684 | 861.114 | 100.758 |
2022-09-30 | 1,712.504 | 907.361 | 232.171 |
2022-06-30 | 1,647.708 | 767.537 | 681.909 |
2022-03-31 | 1,509.526 | 665.055 | 918.003 |
2021-12-31 | 1,364.585 | 618.875 | 818.643 |
2021-09-30 | 1,209.372 | 541.241 | 938.196 |
KIM's Quality Factors
The “Quality” component of the POWR Ratings focuses on 31 different factors of a companies fundamentals and operational strength. Here are some key insights as we drill into the specifics of these quality attributes.- KIM has a Quality Grade of C, ranking ahead of 43.58% of graded US stocks.
- KIM's asset turnover comes in at 0.095 -- ranking 223rd of 444 Trading stocks.
- BHR, SOHO, and APLE are the stocks whose asset turnover ratios are most correlated with KIM.
The table below shows KIM's key quality metrics over time.
Period | Asset Turnover | Gross Margin | ROIC |
---|---|---|---|
2021-06-30 | 0.095 | 0.677 | 0.036 |
2021-03-31 | 0.091 | 0.670 | 0.074 |
2020-12-31 | 0.092 | 0.676 | 0.071 |
2020-09-30 | 0.096 | 0.685 | 0.066 |
2020-06-30 | 0.099 | 0.696 | 0.073 |
2020-03-31 | 0.104 | 0.706 | 0.034 |
KIM Price Target
For more insight on analysts targets of KIM, see our KIM price target page. And for a list of of all stocks sorted by upside potential based on analyst target price, see our Top Price Target page.
Average Price Target | $24.36 | Average Broker Recommendation | 1.65 (Moderate Buy) |
KIM Stock Price Chart Interactive Chart >
KIM Price/Volume Stats
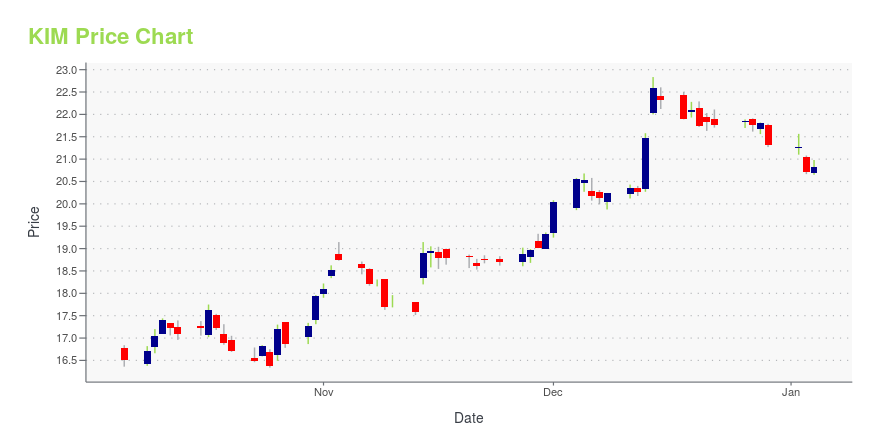
Current price | $18.22 | 52-week high | $26.57 |
Prev. close | $18.10 | 52-week low | $17.61 |
Day low | $18.14 | Volume | 4,311,500 |
Day high | $18.53 | Avg. volume | 4,745,085 |
50-day MA | $20.88 | Dividend yield | 5.21% |
200-day MA | $20.95 | Market Cap | 11.29B |
Kimco Realty Corp. (KIM) Company Bio
Kimco Realty Corporation is a real estate investment trust that invests in shopping centers. As of March 31, 2022, the company owned interests in 537 U.S. shopping centers and mixed-use assets comprising 93 million square feet of gross leasable space. (Source:Wikipedia)
Latest KIM News From Around the Web
Below are the latest news stories about KIMCO REALTY CORP that investors may wish to consider to help them evaluate KIM as an investment opportunity.
3 Dividend Stocks You Can Safely Hold for DecadesInvestors who are looking for income should spend some time looking at real estate investment trusts (REITs). Many have long track records of solid performance over many (and varied) economic cycles. Realty Income (NYSE: O) is a defensive REIT that has a long track record of performance that goes back all the way to the late 1960s. |
Despite lower earnings than three years ago, Kimco Realty (NYSE:KIM) investors are up 107% since thenIt might be of some concern to shareholders to see the Kimco Realty Corporation ( NYSE:KIM ) share price down 13% in... |
2 Dividend Stocks That Will Pay You for LifeIncome investors, by their nature, tend to look at stocks with stable business models that have a nice payout. As a result, the core of an income investor's portfolio will often contain real estate investment trusts (REITs), master limited partnerships (MLPs), and regulated utilities. Kimco Realty (NYSE: KIM) is a REIT that operates grocery-anchored shopping centers and other mixed-use assets. |
Is it Wise to Retain Kimco (KIM) Stock in Your Portfolio Now?Kimco's (KIM) focus on its grocery-anchored centers, mixed-use assets and solid balance sheet bode well for its growth. However, the rise in e-commerce adoption and higher interest rates are woes. |
Thinking Of Buying Kimco Realty? Here Are The Properties And Tenants You'd Be Adding To Your PortfolioWhen an investor decides to buy a real estate investment trust (REIT), they are not just buying a real estate company. In essence, they are also buying the large block of tenants that comprise the leasing portfolio that makes up the REIT. So before you decide to buy any REIT, consider the makeup and solvency of the vast majority of its tenant base. Ask yourself these questions: Are there any tenants who are facing bankruptcy or closing a large number of stores? Are the tenants high quality? Are |
KIM Price Returns
1-mo | N/A |
3-mo | -11.79% |
6-mo | -0.96% |
1-year | -22.22% |
3-year | 94.99% |
5-year | 68.41% |
YTD | -12.96% |
2022 | -10.80% |
2021 | 69.48% |
2020 | -23.94% |
2019 | 49.75% |
2018 | -13.26% |
KIM Dividends
Ex-Dividend Date | Type | Payout Amount | Change | ||||||
---|---|---|---|---|---|---|---|---|---|
Loading, please wait... |
Continue Researching KIM
Want to see what other sources are saying about Kimco Realty Corp's financials and stock price? Try the links below:Kimco Realty Corp (KIM) Stock Price | Nasdaq
Kimco Realty Corp (KIM) Stock Quote, History and News - Yahoo Finance
Kimco Realty Corp (KIM) Stock Price and Basic Information | MarketWatch
Loading social stream, please wait...