Luxfer Holdings PLC Ordinary Shares (LXFR): Price and Financial Metrics
LXFR Price/Volume Stats
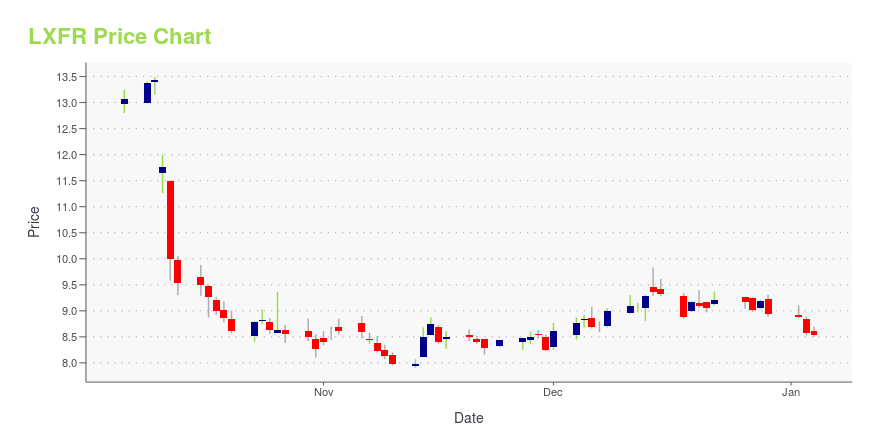
Current price | $12.61 | 52-week high | $17.83 |
Prev. close | $12.65 | 52-week low | $11.27 |
Day low | $12.40 | Volume | 26,188 |
Day high | $12.62 | Avg. volume | 126,165 |
50-day MA | $12.46 | Dividend yield | 4.12% |
200-day MA | $14.61 | Market Cap | 339.49M |
LXFR Stock Price Chart Interactive Chart >
LXFR POWR Grades
- Quality is the dimension where LXFR ranks best; there it ranks ahead of 80.99% of US stocks.
- LXFR's strongest trending metric is Value; it's been moving up over the last 179 days.
- LXFR ranks lowest in Growth; there it ranks in the 27th percentile.
LXFR Stock Summary
- LUXFER HOLDINGS PLC's capital turnover -- a measure of revenue relative to shareholder's equity -- is better than 71.67% of US listed stocks.
- LXFR's price/sales ratio is 0.79; that's higher than the P/S ratio of 27.21% of US stocks.
- With a year-over-year growth in debt of 21.74%, LUXFER HOLDINGS PLC's debt growth rate surpasses 75.96% of about US stocks.
- Stocks with similar financial metrics, market capitalization, and price volatility to LUXFER HOLDINGS PLC are REZI, CMCO, IMPL, EPC, and PWFL.
- LXFR's SEC filings can be seen here. And to visit LUXFER HOLDINGS PLC's official web site, go to www.luxfer.com.
LXFR Valuation Summary
- LXFR's price/sales ratio is 0.8; this is 33.33% lower than that of the median Industrials stock.
- LXFR's EV/EBIT ratio has moved up 12.6 over the prior 133 months.
Below are key valuation metrics over time for LXFR.
Stock | Date | P/S | P/B | P/E | EV/EBIT |
---|---|---|---|---|---|
LXFR | 2023-09-15 | 0.8 | 1.6 | 22.3 | 18.6 |
LXFR | 2023-09-14 | 0.8 | 1.6 | 22.5 | 18.7 |
LXFR | 2023-09-13 | 0.8 | 1.5 | 21.9 | 18.3 |
LXFR | 2023-09-12 | 0.8 | 1.5 | 21.8 | 18.2 |
LXFR | 2023-09-11 | 0.8 | 1.5 | 21.5 | 18.1 |
LXFR | 2023-09-08 | 0.8 | 1.5 | 21.3 | 17.9 |
LXFR Growth Metrics
- Its year over year revenue growth rate is now at 26.03%.
- Its year over year cash and equivalents growth rate is now at -45.6%.
- The 4 year net income to common stockholders growth rate now stands at -33.84%.

The table below shows LXFR's growth in key financial areas (numbers in millions of US dollars).
Date | Revenue | Operating Cash Flow | Net Income to Common Stock |
---|---|---|---|
2022-09-30 | 405.4 | -11.2 | 24.5 |
2022-06-30 | 396.4 | -5.1 | 21.3 |
2022-03-31 | 385.9 | 1.6 | 23 |
2021-12-31 | 374.1 | 26.1 | 29.9 |
2021-09-30 | 316.5 | 47 | 37.4 |
2021-06-30 | 315.7 | 64.5 | 35.2 |
LXFR's Quality Factors
The “Quality” component of the POWR Ratings focuses on 31 different factors of a companies fundamentals and operational strength. Here are some key insights as we drill into the specifics of these quality attributes.- LXFR has a Quality Grade of A, ranking ahead of 95.37% of graded US stocks.
- LXFR's asset turnover comes in at 0.857 -- ranking 23rd of 89 Chemicals stocks.
- SMG, TSE, and GEVO are the stocks whose asset turnover ratios are most correlated with LXFR.
The table below shows LXFR's key quality metrics over time.
Period | Asset Turnover | Gross Margin | ROIC |
---|---|---|---|
2021-09-26 | 0.857 | 0.289 | 0.184 |
2021-06-27 | 0.861 | 0.281 | 0.179 |
2021-03-28 | 0.836 | 0.266 | 0.150 |
2020-12-31 | 0.885 | 0.249 | 0.112 |
2020-09-27 | 1.014 | 0.217 | 0.078 |
2020-06-28 | 1.029 | 0.226 | 0.075 |
Luxfer Holdings PLC Ordinary Shares (LXFR) Company Bio
Luxfer Holdings PLC designs, manufactures, and supplies materials, components, and high-pressure gas-containment devices for environmental, healthcare, protection, and specialty end-markets in Europe, North America, and internationally. The company was founded in 1898 and is based in Salford, England.
Latest LXFR News From Around the Web
Below are the latest news stories about LUXFER HOLDINGS PLC that investors may wish to consider to help them evaluate LXFR as an investment opportunity.
11 Oversold Dividend Stocks to Invest InIn this article, we discuss 11 oversold dividend stocks to invest in. You can skip our detailed analysis of dividend stocks and their performance over the years, and go directly to read 5 Oversold Dividend Stocks to Invest In. Dividend investing stands as a highly significant investment strategy for generating reliable and stable cash flow. […] |
At US$12.64, Is Luxfer Holdings PLC (NYSE:LXFR) Worth Looking At Closely?Luxfer Holdings PLC ( NYSE:LXFR ), might not be a large cap stock, but it saw significant share price movement during... |
Luxfer Announces Second Quarter 2023 Financial ResultsMILWAUKEE, July 25, 2023--Luxfer Holdings PLC (NYSE: LXFR) ("Luxfer" or the "Company"), a global industrial company innovating niche applications in materials engineering, today announced financial results for the second quarter 2023, ended July 2, 2023. |
Luxfer Announces Date of Second Quarter 2023 Earnings ReleaseMILWAUKEE, July 12, 2023--Luxfer Holdings PLC (NYSE: LXFR) ("Luxfer" or the "Company"), a global industrial company innovating niche applications in materials engineering, today announced that it will release financial results for the second quarter of 2023 after market close on Tuesday, July 25, 2023. A conference call is scheduled for Wednesday, July 26, 2023 at 8:30 a.m. U.S. Eastern Daylight Time (EDT), during which management will provide a review of the Company’s second quarter financial r |
Pleasing Signs As A Number Of Insiders Buy Luxfer Holdings StockWhen a single insider purchases stock, it is typically not a major deal. However, when multiple insiders purchase... |
LXFR Price Returns
1-mo | 10.42% |
3-mo | -15.45% |
6-mo | -19.45% |
1-year | -13.17% |
3-year | 11.66% |
5-year | -41.88% |
YTD | -5.59% |
2022 | -26.63% |
2021 | 20.57% |
2020 | -8.79% |
2019 | 4.99% |
2018 | 12.53% |
LXFR Dividends
Ex-Dividend Date | Type | Payout Amount | Change | ||||||
---|---|---|---|---|---|---|---|---|---|
Loading, please wait... |
Loading social stream, please wait...