Moelis & Company (MC): Price and Financial Metrics
GET POWR RATINGS... FREE!
MC POWR Grades
- Quality is the dimension where MC ranks best; there it ranks ahead of 94.54% of US stocks.
- The strongest trend for MC is in Sentiment, which has been heading down over the past 179 days.
- MC's current lowest rank is in the Sentiment metric (where it is better than 3.13% of US stocks).
MC Stock Summary
- Moelis & Co's capital turnover -- a measure of revenue relative to shareholder's equity -- is better than 84.67% of US listed stocks.
- The price/operating cash flow metric for Moelis & Co is higher than only 11.06% of stocks in our set with a positive cash flow.
- Revenue growth over the past 12 months for Moelis & Co comes in at 63.33%, a number that bests 86.04% of the US stocks we're tracking.
- Stocks that are quantitatively similar to MC, based on their financial statements, market capitalization, and price volatility, are CNS, OEG, WTER, AAON, and USLM.
- MC's SEC filings can be seen here. And to visit Moelis & Co's official web site, go to www.moelis.com.
MC Valuation Summary
- MC's price/sales ratio is 3.2; this is 166.67% higher than that of the median Financial Services stock.
- MC's price/sales ratio has moved down 0.1 over the prior 89 months.
Below are key valuation metrics over time for MC.
Stock | Date | P/S | P/B | P/E | EV/EBIT |
---|---|---|---|---|---|
MC | 2019-08-08 | 2.8 | 5.5 | 17.7 | 14.8 |
MC | 2019-06-14 | 2.4 | 5.5 | 15.8 | 13.1 |
MC | 2019-05-10 | 2.5 | 5.9 | 16.8 | 14.0 |
MC | 2017-10-02 | 3.3 | 8.3 | 38.6 | 23.3 |
MC | 2016-02-26 | 2.4 | 8.4 | 39.4 | 21.1 |
MC | 2014-11-26 | 4.0 | 20.9 | 23.7 | 20.9 |
MC Growth Metrics
- The year over year net cashflow from operations growth rate now stands at 85.39%.
- Its 5 year cash and equivalents growth rate is now at 36.6%.
- Its 4 year cash and equivalents growth rate is now at 36.6%.

The table below shows MC's growth in key financial areas (numbers in millions of US dollars).
Date | Revenue | Operating Cash Flow | Net Income to Common Stock |
---|---|---|---|
2021-12-31 | 1,540.611 | 936.98 | 365.213 |
2021-09-30 | 1,537.622 | 872.911 | 392.647 |
2021-06-30 | 1,254.405 | 658.228 | 305.303 |
2021-03-31 | 1,053.436 | 479.341 | 220.23 |
2020-12-31 | 943.276 | 429.215 | 178.831 |
2020-09-30 | 744.776 | 304.012 | 73.8 |
MC's Quality Factors
The “Quality” component of the POWR Ratings focuses on 31 different factors of a companies fundamentals and operational strength. Here are some key insights as we drill into the specifics of these quality attributes.- MC has a Quality Grade of B, ranking ahead of 90.93% of graded US stocks.
- MC's asset turnover comes in at 1.283 -- ranking 9th of 444 Trading stocks.
- MSB, GEO, and SEB are the stocks whose asset turnover ratios are most correlated with MC.
The table below shows MC's key quality metrics over time.
Period | Asset Turnover | Gross Margin | ROIC |
---|---|---|---|
2021-09-30 | 1.283 | 1 | 0.443 |
2021-06-30 | 1.130 | 1 | 0.353 |
2021-03-31 | 0.978 | 1 | 0.246 |
2020-12-31 | 0.914 | 1 | 0.210 |
2020-09-30 | 0.745 | 1 | 0.060 |
2020-06-30 | 0.822 | 1 | 0.079 |
MC Price Target
For more insight on analysts targets of MC, see our MC price target page. And for a list of of all stocks sorted by upside potential based on analyst target price, see our Top Price Target page.
Average Price Target | $63.50 | Average Broker Recommendation | 2 (Hold) |
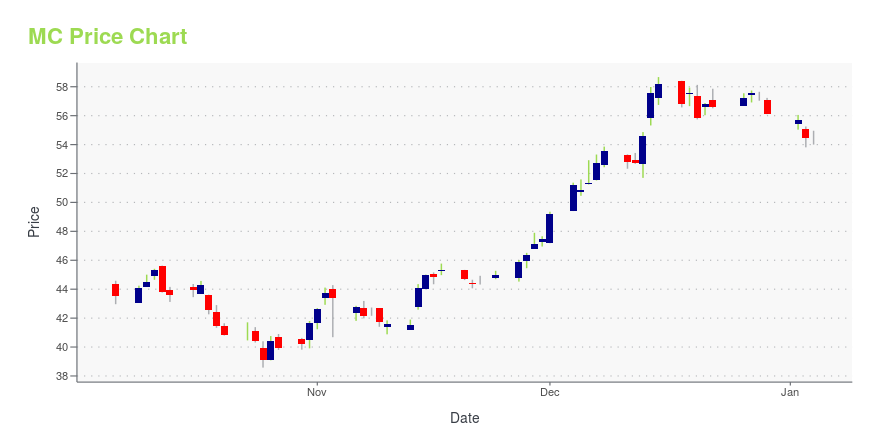
MC Stock Price Chart Interactive Chart >
MC Price/Volume Stats
Current price | $39.66 | 52-week high | $77.49 |
Prev. close | $39.35 | 52-week low | $37.16 |
Day low | $38.95 | Volume | 385,200 |
Day high | $40.02 | Avg. volume | 563,972 |
50-day MA | $42.98 | Dividend yield | 6.05% |
200-day MA | $54.68 | Market Cap | 2.76B |
Moelis & Company (MC) Company Bio
Moelis & Company provides strategic and financial advisory services in the United States and internationally. It advises clients in the areas of mergers and acquisitions, recapitalizations and restructurings, and other corporate finance matters. The company was founded in 2007 and is based in New York, New York.
Latest MC News From Around the Web
Below are the latest news stories about Moelis & Co that investors may wish to consider to help them evaluate MC as an investment opportunity.
Will Moelis & Company (NYSE: MC) Stock Boom Or Bust From Here?During the last session, Moelis & Company (NYSE:MC)s traded shares were 0.46 million, with the beta value of the company hitting 1.24. At the end of the trading day, the stocks price was $48.82, reflecting an intraday loss of -2.09% or -$1.04. The 52-week high for the MC share is $76.19, that puts it down Will Moelis & Company (NYSE: MC) Stock Boom Or Bust From Here? Read More » |
Want $2,000 per Year in Passive Income? Invest $54,000 in These 3 Dividend StocksDividend stocks can be a great source of returns in the stock market -- especially when inflationary pressures take hold. According to Fidelity, dividend payments have accounted for 40% of the stock market's total return since 1930. During the inflationary decades of the 1940s and 1970s, Fidelity found that dividends accounted for 65% and 71% of the S&P 500's total returns, respectively. |
Moelis & Company – Consensus Indicates Potential 39.1% UpsideMoelis & Company with ticker code (MC) now have 8 analysts in total covering the stock. The consensus rating is ''Hold''. The target price ranges between 79 and 59 and has a mean target at 71.75. With the stocks previous close at 51.59 this indicates there is a potential upside of 39.1%. The 50 day moving average now sits at 58.73 and the 200 day MA is 60.46. The market capitalisation for the company is $3,553m. Visit the company website at: https://www.moelis.com [stock_market_widget type="chart" symbol="MC" chart="bar" range="6mo" interval="1d" line-color="rgb(49, 125, 189)"] The potential market cap would be $4,941m based on the market concensus. Moelis & Company operates as an investment banking advisory firm in the United States, Europe, and internationally. It offers advisory serv... |
Moelis & Company's (MC) CEO Ken Moelis on Q4 2021 Earnings Call TranscriptMoelis & Company (MC) Q4 2021 Earnings Conference Call Feb 09, 2022 05:00 PM ET Company Participants Chett Mandel - Head, IR Joe Simon - CFO Ken Moelis - Chairman and CEO Conference Call Participants Ken Worthington - JPMorgan Brendan O'Brien - Wolfe Research Brennan Hawken - UBS Manan Gosalia... |
Expert Ratings For Moelis & CoMoelis & Co (NYSE: MC ) has observed the following analyst ratings within the last quarter: Bullish Somewhat Bullish Indifferent Somewhat Bearish Bearish Total Ratings 1 1 3 0 0 Last 30D 0 0 1 0 0 1M Ago 0 0 0 0 0 2M Ago 1 1 1 0 0 3M Ago 0 0 1 0 0 According to 5 analyst offering 12-month price targets in the last 3 months, Moelis & Co has an average price target of $69.6 with a high of $77.00 and a low of $65.00. Below is a summary of how these 5 analysts rated Moelis & Co over the past … Full story available on Benzinga.com |
MC Price Returns
1-mo | -16.56% |
3-mo | -15.23% |
6-mo | -34.87% |
1-year | -24.97% |
3-year | 49.84% |
5-year | 56.42% |
YTD | -34.88% |
2021 | 49.03% |
2020 | 62.83% |
2019 | 0.80% |
2018 | -22.52% |
2017 | 48.57% |
MC Dividends
Ex-Dividend Date | Type | Payout Amount | Change | ||||||
---|---|---|---|---|---|---|---|---|---|
Loading, please wait... |
Continue Researching MC
Here are a few links from around the web to help you further your research on Moelis & Co's stock as an investment opportunity:Moelis & Co (MC) Stock Price | Nasdaq
Moelis & Co (MC) Stock Quote, History and News - Yahoo Finance
Moelis & Co (MC) Stock Price and Basic Information | MarketWatch
Loading social stream, please wait...