McCormick & Co. Inc. (MKC): Price and Financial Metrics
MKC Price/Volume Stats
Current price | $75.64 | 52-week high | $94.39 |
Prev. close | $74.65 | 52-week low | $70.60 |
Day low | $75.02 | Volume | 1,661,700 |
Day high | $76.13 | Avg. volume | 1,389,093 |
50-day MA | $83.00 | Dividend yield | 2.09% |
200-day MA | $82.82 | Market Cap | 20.30B |
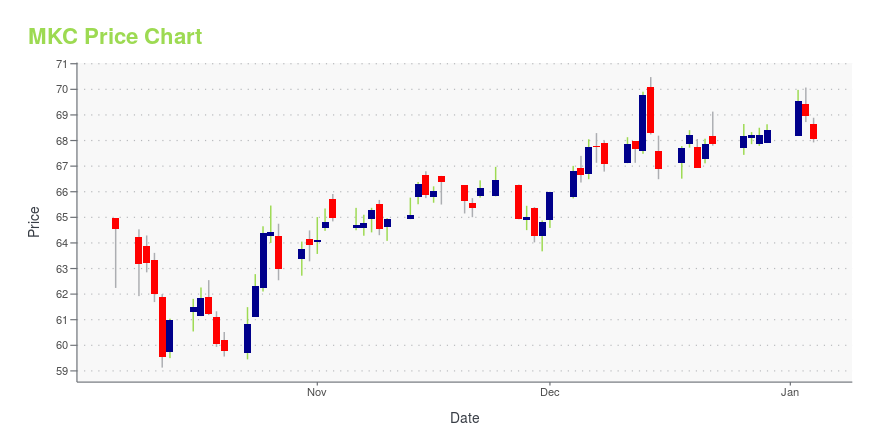
MKC Stock Price Chart Interactive Chart >
MKC POWR Grades
- MKC scores best on the Stability dimension, with a Stability rank ahead of 78% of US stocks.
- The strongest trend for MKC is in Growth, which has been heading down over the past 177 days.
- MKC's current lowest rank is in the Sentiment metric (where it is better than 8.2% of US stocks).
MKC Stock Summary
- MKC has a market capitalization of $20,540,394,953 -- more than approximately 90.31% of US stocks.
- MKC's one year PEG ratio, measuring expected growth in earnings next year relative to current common stock price is 281.42 -- higher than 89.92% of US-listed equities with positive expected earnings growth.
- MCCORMICK & CO INC's stock had its IPO on March 26, 1990, making it an older stock than 85.48% of US equities in our set.
- If you're looking for stocks that are quantitatively similar to MCCORMICK & CO INC, a group of peers worth examining would be IEX, CDW, BRO, HUBB, and J.
- MKC's SEC filings can be seen here. And to visit MCCORMICK & CO INC's official web site, go to www.mccormickcorporation.com.
MKC Valuation Summary
- In comparison to the median Consumer Defensive stock, MKC's price/sales ratio is 255.56% higher, now standing at 3.2.
- MKC's price/sales ratio has moved up 1.6 over the prior 243 months.
Below are key valuation metrics over time for MKC.
Stock | Date | P/S | P/B | P/E | EV/EBIT |
---|---|---|---|---|---|
MKC | 2023-09-22 | 3.2 | 4.2 | 31.2 | 24.5 |
MKC | 2023-09-21 | 3.2 | 4.2 | 31.6 | 24.8 |
MKC | 2023-09-20 | 3.2 | 4.3 | 32.1 | 25.1 |
MKC | 2023-09-19 | 3.2 | 4.3 | 32.1 | 25.1 |
MKC | 2023-09-18 | 3.3 | 4.3 | 32.6 | 25.4 |
MKC | 2023-09-15 | 3.3 | 4.3 | 32.6 | 25.4 |
MKC Growth Metrics
- The year over year price growth rate now stands at 7.79%.
- Its 3 year cash and equivalents growth rate is now at 230.79%.
- Its 2 year net income to common stockholders growth rate is now at 6.38%.

The table below shows MKC's growth in key financial areas (numbers in millions of US dollars).
Date | Revenue | Operating Cash Flow | Net Income to Common Stock |
---|---|---|---|
2022-12-31 | 6,350.5 | 651.5 | 644.2 |
2022-09-30 | 6,385.1 | 705.5 | 660.1 |
2022-06-30 | 6,338.9 | 754 | 648 |
2022-03-31 | 6,358.8 | 878.4 | 700.2 |
2021-12-31 | 6,317.9 | 828.3 | 703.1 |
2021-09-30 | 6,145.5 | 787.5 | 702.2 |
MKC's Quality Factors
The “Quality” component of the POWR Ratings focuses on 31 different factors of a companies fundamentals and operational strength. Here are some key insights as we drill into the specifics of these quality attributes.- MKC has a Quality Grade of C, ranking ahead of 53.35% of graded US stocks.
- MKC's asset turnover comes in at 0.487 -- ranking 43rd of 58 Food Products stocks.
- SAFM, LWAY, and RIBT are the stocks whose asset turnover ratios are most correlated with MKC.
The table below shows MKC's key quality metrics over time.
Period | Asset Turnover | Gross Margin | ROIC |
---|---|---|---|
2021-08-31 | 0.487 | 0.399 | 0.167 |
2021-05-31 | 0.498 | 0.405 | 0.172 |
2021-02-28 | 0.508 | 0.410 | 0.182 |
2020-11-30 | 0.509 | 0.411 | 0.186 |
2020-08-31 | 0.523 | 0.411 | 0.193 |
2020-05-31 | 0.519 | 0.409 | 0.190 |
MKC Price Target
For more insight on analysts targets of MKC, see our MKC price target page. And for a list of of all stocks sorted by upside potential based on analyst target price, see our Top Price Target page.
Average Price Target | $90.64 | Average Broker Recommendation | 2 (Hold) |
McCormick & Co. Inc. (MKC) Company Bio
McCormick & Company is an American food company that manufactures, markets, and distributes spices, seasoning mixes, condiments, and other flavoring products to retail outlets, food manufacturers, and foodservice businesses. (Source:Wikipedia)
Latest MKC News From Around the Web
Below are the latest news stories about MCCORMICK & CO INC that investors may wish to consider to help them evaluate MKC as an investment opportunity.
McCormick Declares $0.39 Quarterly DividendThe Board of Directors of McCormick & Company, Incorporated (NYSE:MKC) declared a quarterly dividend of $0.39 per share on its common stocks, payable October 24, 2023 to shareholders of record October 10, 2023. |
What Awaits McCormick (MKC) as It Queues for Q3 Earnings?McCormick's (MKC) third-quarter results are likely to reflect the impacts of cost inflation and high SG&A costs. However, a focus on the CCI and GOE programs bodes well. |
Unveiling the Investment Potential of McCormick & Co Inc (MKC): A Comprehensive Analysis of ...Delving into the financial growth, competitive edges, and market leadership of McCormick & Co Inc (MKC) |
Unveiling McCormick (MKC)'s Value: Is It Really Priced Right? A Comprehensive GuideDelving into the intrinsic value of McCormick (MKC) to determine its investment potential |
Earnings Preview: McCormick (MKC) Q3 Earnings Expected to DeclineMcCormick (MKC) doesn't possess the right combination of the two key ingredients for a likely earnings beat in its upcoming report. Get prepared with the key expectations. |
MKC Price Returns
1-mo | -5.99% |
3-mo | N/A |
6-mo | -10.52% |
1-year | 8.16% |
3-year | -17.82% |
5-year | 22.22% |
YTD | -7.91% |
2022 | -12.65% |
2021 | 2.67% |
2020 | 14.29% |
2019 | 23.65% |
2018 | 39.01% |
MKC Dividends
Ex-Dividend Date | Type | Payout Amount | Change | ||||||
---|---|---|---|---|---|---|---|---|---|
Loading, please wait... |
Continue Researching MKC
Here are a few links from around the web to help you further your research on Mccormick & Co Inc's stock as an investment opportunity:Mccormick & Co Inc (MKC) Stock Price | Nasdaq
Mccormick & Co Inc (MKC) Stock Quote, History and News - Yahoo Finance
Mccormick & Co Inc (MKC) Stock Price and Basic Information | MarketWatch
Loading social stream, please wait...