Marathon Oil Corporation (MRO): Price and Financial Metrics
GET POWR RATINGS... FREE!
MRO POWR Grades
- Quality is the dimension where MRO ranks best; there it ranks ahead of 97.9% of US stocks.
- MRO's strongest trending metric is Growth; it's been moving down over the last 177 days.
- MRO's current lowest rank is in the Stability metric (where it is better than 12.6% of US stocks).
MRO Stock Summary
- With a one year PEG ratio of 0.2, MARATHON OIL CORP is expected to have a higher PEG ratio (a measure of how expensive a stock is relative to its expected earnings growth) than just 2.29% of US stocks.
- Of note is the ratio of MARATHON OIL CORP's sales and general administrative expense to its total operating expenses; just 3.94% of US stocks have a lower such ratio.
- Over the past twelve months, MRO has reported earnings growth of 2,228.82%, putting it ahead of 99.19% of US stocks in our set.
- Stocks with similar financial metrics, market capitalization, and price volatility to MARATHON OIL CORP are PDCE, TDOC, PSFE, SBOW, and ETWO.
- Visit MRO's SEC page to see the company's official filings. To visit the company's web site, go to www.marathonoil.com.
MRO Valuation Summary
- In comparison to the median Energy stock, MRO's EV/EBIT ratio is 49.75% lower, now standing at 5.1.
- Over the past 243 months, MRO's price/sales ratio has gone up 1.8.
Below are key valuation metrics over time for MRO.
Stock | Date | P/S | P/B | P/E | EV/EBIT |
---|---|---|---|---|---|
MRO | 2023-01-13 | 2.1 | 1.5 | 4.6 | 5.1 |
MRO | 2023-01-12 | 2.1 | 1.6 | 4.7 | 5.1 |
MRO | 2023-01-11 | 2.1 | 1.5 | 4.6 | 5.1 |
MRO | 2023-01-10 | 2.1 | 1.5 | 4.6 | 5.1 |
MRO | 2023-01-09 | 2.1 | 1.5 | 4.6 | 5.1 |
MRO | 2023-01-06 | 2.1 | 1.5 | 4.5 | 5.0 |
MRO Growth Metrics
- Its 5 year revenue growth rate is now at 4.63%.
- Its 3 year price growth rate is now at 78.35%.
- The 4 year cash and equivalents growth rate now stands at -67.19%.

The table below shows MRO's growth in key financial areas (numbers in millions of US dollars).
Date | Revenue | Operating Cash Flow | Net Income to Common Stock |
---|---|---|---|
2022-09-30 | 8,103 | 5,447 | 3,736 |
2022-06-30 | 7,309 | 4,707 | 3,103 |
2022-03-31 | 6,149 | 3,684 | 2,153 |
2021-12-31 | 5,467 | 3,239 | 946 |
2021-09-30 | 4,497 | 2,511 | -41 |
2021-06-30 | 3,798 | 2,040 | -542 |
MRO's Quality Factors
The “Quality” component of the POWR Ratings focuses on 31 different factors of a companies fundamentals and operational strength. Here are some key insights as we drill into the specifics of these quality attributes.- MRO has a Quality Grade of B, ranking ahead of 82.94% of graded US stocks.
- MRO's asset turnover comes in at 0.209 -- ranking 105th of 136 Petroleum and Natural Gas stocks.
- CVX, XOM, and BDCO are the stocks whose asset turnover ratios are most correlated with MRO.
The table below shows MRO's key quality metrics over time.
Period | Asset Turnover | Gross Margin | ROIC |
---|---|---|---|
2021-06-30 | 0.209 | 0.690 | -0.015 |
2021-03-31 | 0.159 | 0.617 | -0.051 |
2020-12-31 | 0.165 | 0.627 | -0.055 |
2020-09-30 | 0.180 | 0.665 | -0.038 |
2020-06-30 | 0.206 | 0.717 | -0.017 |
2020-03-31 | 0.256 | 0.755 | 0.025 |
MRO Price Target
For more insight on analysts targets of MRO, see our MRO price target page. And for a list of of all stocks sorted by upside potential based on analyst target price, see our Top Price Target page.
Average Price Target | $15.96 | Average Broker Recommendation | 1.62 (Moderate Buy) |
MRO Stock Price Chart Interactive Chart >
MRO Price/Volume Stats
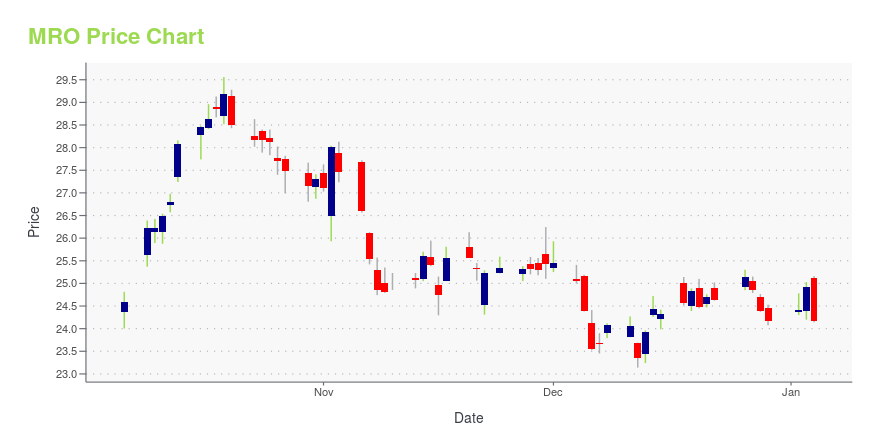
Current price | $26.03 | 52-week high | $33.42 |
Prev. close | $26.19 | 52-week low | $19.42 |
Day low | $25.99 | Volume | 10,744,200 |
Day high | $26.86 | Avg. volume | 9,359,165 |
50-day MA | $27.67 | Dividend yield | 1.38% |
200-day MA | $26.58 | Market Cap | 16.48B |
Marathon Oil Corporation (MRO) Company Bio
Marathon Oil Corp is an exploration and production company. It focuses on producing crude oil and condensate, natural gas liquids and natural gas as well as bitumen from oil sands deposits. In 2011, Marathon Oil spun off from Marathon Petroleum Corporation becoming an independent exploration and production company. The company has operations in four of the oil rich basins in the United States – the Eagle Ford Basin, the Bakken Basin, the STACK/SCOOP basin, and the Permian Basin. Marathon Oil employs just under 1,700 individuals and is headquartered in Houston, Texas. Lee Tillman serves as President and Chief Executive Officer.
Latest MRO News From Around the Web
Below are the latest news stories about MARATHON OIL CORP that investors may wish to consider to help them evaluate MRO as an investment opportunity.
Marathon Oil (MRO) Gains But Lags Market: What You Should KnowIn the latest trading session, Marathon Oil (MRO) closed at $27.47, marking a +1.4% move from the previous day. |
Top 25 Lowest P/E Ratios of the S&P 500In this article, we will take a look at the top 25 lowest P/E ratios of the S&P 500. You can skip this part and go to Top 5 Lowest P/E Ratios of the S&P 500. US equities were hammered in 2022 amid the broader market downturn, rising inflation and the Federal Reserve’s rate-hike spree. However, […] |
20 Stocks That Are Aggressively Buying Back Shares According To Goldman SachsIn this article, we discuss 20 stocks that are aggressively buying back shares according to Goldman Sachs. If you want to see more stocks in this selection, check out 5 Stocks That Are Aggressively Buying Back Shares According To Goldman Sachs. Goldman Sachs US equity strategy chief David Kostin noted in the beginning of November […] |
Marathon Oil Stock Appears Undervalued Based On Competitor AnalysisMarathon Oil is relatively small and can scale up a lot in the coming years. Read more to see our competitor analysis and why we rate MRO stock a buy now. |
Stock market today: Dow wobbles on jitters ahead of Fed meeting, big tech earningsBy Yasin Ebrahim |
MRO Price Returns
1-mo | -2.14% |
3-mo | -20.97% |
6-mo | 19.27% |
1-year | 22.58% |
3-year | 126.62% |
5-year | 60.81% |
YTD | -3.84% |
2022 | 66.91% |
2021 | 149.77% |
2020 | -50.38% |
2019 | -3.93% |
2018 | -14.37% |
MRO Dividends
Ex-Dividend Date | Type | Payout Amount | Change | ||||||
---|---|---|---|---|---|---|---|---|---|
Loading, please wait... |
Continue Researching MRO
Want to do more research on Marathon Oil Corp's stock and its price? Try the links below:Marathon Oil Corp (MRO) Stock Price | Nasdaq
Marathon Oil Corp (MRO) Stock Quote, History and News - Yahoo Finance
Marathon Oil Corp (MRO) Stock Price and Basic Information | MarketWatch
Loading social stream, please wait...