NACCO Industries, Inc. (NC): Price and Financial Metrics
NC Price/Volume Stats
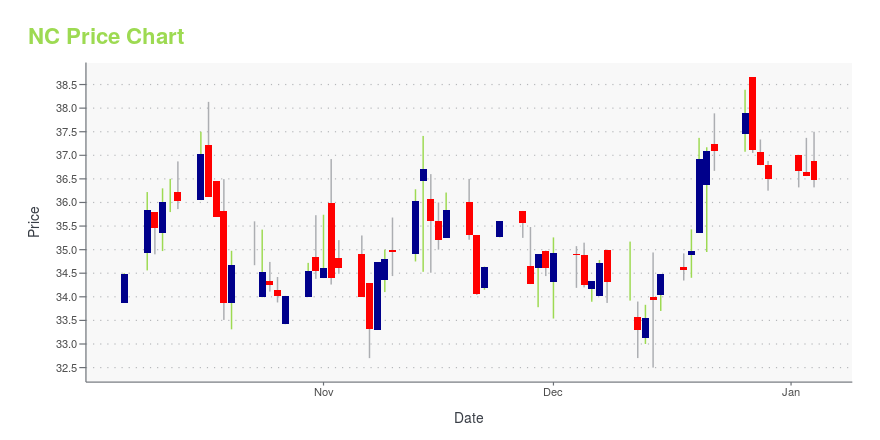
Current price | $31.62 | 52-week high | $63.19 |
Prev. close | $32.50 | 52-week low | $30.19 |
Day low | $31.39 | Volume | 18,900 |
Day high | $32.20 | Avg. volume | 16,435 |
50-day MA | $34.89 | Dividend yield | 2.55% |
200-day MA | $41.54 | Market Cap | 237.47M |
NC Stock Price Chart Interactive Chart >
NC POWR Grades
- NC scores best on the Sentiment dimension, with a Sentiment rank ahead of 82.62% of US stocks.
- NC's strongest trending metric is Growth; it's been moving up over the last 179 days.
- NC ranks lowest in Growth; there it ranks in the 1st percentile.
NC Stock Summary
- NC's went public 37.42 years ago, making it older than 93.61% of listed US stocks we're tracking.
- Of note is the ratio of NACCO INDUSTRIES INC's sales and general administrative expense to its total operating expenses; just 0% of US stocks have a lower such ratio.
- The ratio of debt to operating expenses for NACCO INDUSTRIES INC is higher than it is for about merely 0.13% of US stocks.
- If you're looking for stocks that are quantitatively similar to NACCO INDUSTRIES INC, a group of peers worth examining would be CRESY, AFIB, ALEX, LMNR, and IRS.
- Visit NC's SEC page to see the company's official filings. To visit the company's web site, go to www.nacco.com.
NC Valuation Summary
- NC's price/sales ratio is 1; this is 16.67% lower than that of the median Basic Materials stock.
- Over the past 243 months, NC's EV/EBIT ratio has gone down 5.2.
Below are key valuation metrics over time for NC.
Stock | Date | P/S | P/B | P/E | EV/EBIT |
---|---|---|---|---|---|
NC | 2023-05-17 | 1 | 0.6 | 3.5 | 1.8 |
NC | 2023-05-16 | 1 | 0.5 | 3.5 | 1.8 |
NC | 2023-05-15 | 1 | 0.6 | 3.5 | 1.8 |
NC | 2023-05-12 | 1 | 0.5 | 3.5 | 1.8 |
NC | 2023-05-11 | 1 | 0.5 | 3.5 | 1.8 |
NC | 2023-05-10 | 1 | 0.6 | 3.6 | 1.8 |
NC Growth Metrics
- The 5 year net cashflow from operations growth rate now stands at -60.03%.
- Its 4 year net income to common stockholders growth rate is now at -3.16%.
- Its 3 year net cashflow from operations growth rate is now at 20.3%.

The table below shows NC's growth in key financial areas (numbers in millions of US dollars).
Date | Revenue | Operating Cash Flow | Net Income to Common Stock |
---|---|---|---|
2022-09-30 | 227.288 | 62.01 | 68.198 |
2022-06-30 | 217.237 | 86.038 | 82.421 |
2022-03-31 | 201.764 | 74.715 | 51.746 |
2021-12-31 | 191.846 | 74.875 | 48.125 |
2021-09-30 | 165.881 | 62.548 | 34.858 |
2021-06-30 | 146.434 | 39.321 | 18.043 |
NACCO Industries, Inc. (NC) Company Bio
NACCO Industries, Inc. operates in the mining, small appliances, and specialty retail businesses worldwide. The company was founded in 1913 and is based in Cleveland, Ohio.
Latest NC News From Around the Web
Below are the latest news stories about NACCO INDUSTRIES INC that investors may wish to consider to help them evaluate NC as an investment opportunity.
NACCO Industries (NYSE:NC) Has Announced That It Will Be Increasing Its Dividend To $0.2175NACCO Industries, Inc. ( NYSE:NC ) has announced that it will be increasing its dividend from last year's comparable... |
NACCO INDUSTRIES DECLARES QUARTERLY DIVIDENDNACCO Industries® (NYSE: NC) today announced that the Board of Directors increased its regular cash dividend from 20.75 cents to 21.75 cents per share. The dividend is payable on both the Class A and Class B Common Stock, and will be paid June 15, 2023 to stockholders of record at the close of business on May 31, 2023. The new dividend is equal to an annual rate of $0.87 per share. |
Institutional investors own a significant stake of 38% in NACCO Industries, Inc. (NYSE:NC)Key Insights Significantly high institutional ownership implies NACCO Industries' stock price is sensitive to their... |
NACCO INDUSTRIES ANNOUNCES FIRST QUARTER 2023 RESULTSNACCO Industries® (NYSE: NC) today announced the following consolidated results for the three months ended March 31, 2023. Comparisons in this news release are to the three months ended March 31, 2022, unless otherwise noted. |
NACCO INDUSTRIES ANNOUNCES DATES OF 2023 FIRST QUARTER EARNINGS RELEASE AND CONFERENCE CALLNACCO Industries® (NYSE: NC) will release its 2023 First Quarter financial results after the close of the market on Wednesday, May 3, 2023. |
NC Price Returns
1-mo | -10.93% |
3-mo | -16.77% |
6-mo | -31.11% |
1-year | -44.02% |
3-year | 29.94% |
5-year | -8.22% |
YTD | -15.79% |
2022 | 6.71% |
2021 | 42.17% |
2020 | -42.28% |
2019 | 40.37% |
2018 | -8.34% |
NC Dividends
Ex-Dividend Date | Type | Payout Amount | Change | ||||||
---|---|---|---|---|---|---|---|---|---|
Loading, please wait... |
Continue Researching NC
Want to see what other sources are saying about Nacco Industries Inc's financials and stock price? Try the links below:Nacco Industries Inc (NC) Stock Price | Nasdaq
Nacco Industries Inc (NC) Stock Quote, History and News - Yahoo Finance
Nacco Industries Inc (NC) Stock Price and Basic Information | MarketWatch
Loading social stream, please wait...