NGL Energy Partners LP (NGL): Price and Financial Metrics
GET POWR RATINGS... FREE!
NGL POWR Grades
- Momentum is the dimension where NGL ranks best; there it ranks ahead of 97.64% of US stocks.
- The strongest trend for NGL is in Growth, which has been heading down over the past 177 days.
- NGL's current lowest rank is in the Stability metric (where it is better than 39.01% of US stocks).
NGL Stock Summary
- NGL ENERGY PARTNERS LP's capital turnover -- a measure of revenue relative to shareholder's equity -- is better than 97.49% of US listed stocks.
- The price/operating cash flow metric for NGL ENERGY PARTNERS LP is higher than just 4.32% of stocks in our set with a positive cash flow.
- With a price/sales ratio of 0.02, NGL ENERGY PARTNERS LP has a higher such ratio than only 0.15% of stocks in our set.
- If you're looking for stocks that are quantitatively similar to NGL ENERGY PARTNERS LP, a group of peers worth examining would be LOV, NRG, BGS, CZR, and IHRT.
- Visit NGL's SEC page to see the company's official filings. To visit the company's web site, go to www.nglenergypartners.com.
NGL Valuation Summary
- In comparison to the median Energy stock, NGL's price/earnings ratio is 115.96% lower, now standing at -1.5.
- Over the past 142 months, NGL's EV/EBIT ratio has gone down 27.3.
Below are key valuation metrics over time for NGL.
Stock | Date | P/S | P/B | P/E | EV/EBIT |
---|---|---|---|---|---|
NGL | 2023-01-13 | 0 | 0.3 | -1.5 | 14.9 |
NGL | 2023-01-12 | 0 | 0.3 | -1.5 | 14.9 |
NGL | 2023-01-11 | 0 | 0.3 | -1.4 | 14.8 |
NGL | 2023-01-10 | 0 | 0.2 | -1.3 | 14.8 |
NGL | 2023-01-09 | 0 | 0.2 | -1.3 | 14.8 |
NGL | 2023-01-06 | 0 | 0.2 | -1.3 | 14.8 |
NGL Growth Metrics
- The 4 year revenue growth rate now stands at -41.76%.
- Its 2 year price growth rate is now at -63.18%.
- Its year over year net income to common stockholders growth rate is now at 60.59%.

The table below shows NGL's growth in key financial areas (numbers in millions of US dollars).
Date | Revenue | Operating Cash Flow | Net Income to Common Stock |
---|---|---|---|
2022-09-30 | 9,211.953 | 182.019 | -133.08 |
2022-06-30 | 8,956.643 | 213.495 | -133.417 |
2022-03-31 | 7,947.915 | 205.846 | -288.63 |
2021-12-31 | 7,167.099 | 145.305 | -485.004 |
2021-09-30 | 6,457.242 | 152.489 | -843.633 |
2021-06-30 | 5,871.263 | 218.418 | -834.482 |
NGL's Quality Factors
The “Quality” component of the POWR Ratings focuses on 31 different factors of a companies fundamentals and operational strength. Here are some key insights as we drill into the specifics of these quality attributes.- NGL has a Quality Grade of D, ranking ahead of 19.83% of graded US stocks.
- NGL's asset turnover comes in at 0.975 -- ranking 80th of 105 Wholesale stocks.
- DIT, SPRS, and INT are the stocks whose asset turnover ratios are most correlated with NGL.
The table below shows NGL's key quality metrics over time.
Period | Asset Turnover | Gross Margin | ROIC |
---|---|---|---|
2021-06-30 | 0.975 | 0.124 | -0.080 |
2021-03-31 | 0.853 | 0.140 | -0.068 |
2020-12-31 | 0.823 | 0.164 | -0.072 |
2020-09-30 | 0.899 | 0.161 | -0.007 |
2020-06-30 | 1.353 | 0.109 | -0.041 |
2020-03-31 | 1.132 | 0.129 | -0.035 |
NGL Stock Price Chart Interactive Chart >
NGL Price/Volume Stats
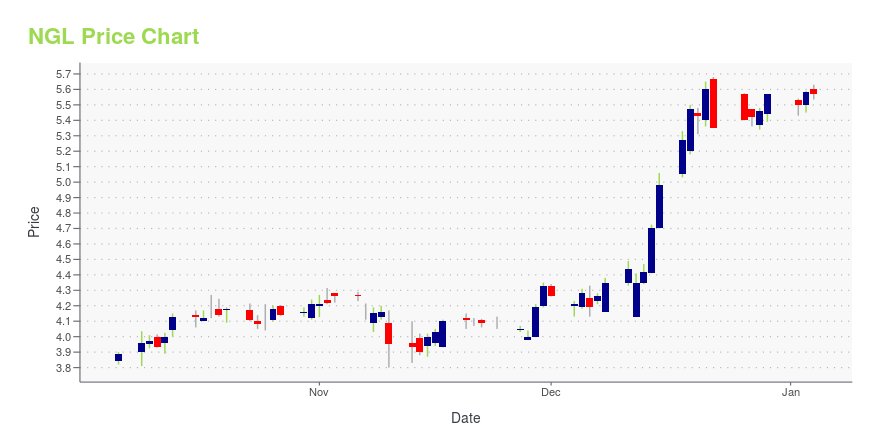
Current price | $1.73 | 52-week high | $2.80 |
Prev. close | $1.65 | 52-week low | $1.00 |
Day low | $1.62 | Volume | 660,400 |
Day high | $1.78 | Avg. volume | 469,948 |
50-day MA | $1.32 | Dividend yield | N/A |
200-day MA | $1.53 | Market Cap | 226.10M |
NGL Energy Partners LP (NGL) Company Bio
NGL Energy Partners LP engages in the crude oil logistics, water solutions, liquids, retail propane, and refined products and renewables businesses in the United States. The company was founded in 1940 and is based in Tulsa, Oklahoma.
Latest NGL News From Around the Web
Below are the latest news stories about NGL ENERGY PARTNERS LP that investors may wish to consider to help them evaluate NGL as an investment opportunity.
NGL Energy Partners Announces Earnings CallTULSA, Okla., January 26, 2023--NGL Energy Partners Announces Earnings Call |
Despite Fast-paced Momentum, NGL Energy Partners LP (NGL) Is Still a Bargain StockNGL Energy Partners LP (NGL) could be a great choice for investors looking to buy stocks that have gained strong momentum recently but are still trading at reasonable prices. It is one of the several stocks that made it through our 'Fast-Paced Momentum at a Bargain' screen. |
NGL ENERGY PARTNERS LP – Consensus Indicates Potential 35.1% UpsideNGL ENERGY PARTNERS LP with ticker code (NGL) have now 2 analysts covering the stock. The analyst consensus points to a rating of ''Hold''. The target price ranges between 2 and 2 with the average target price sitting at 2. With the stocks previous close at 1.48 this would imply there is a potential upside of 35.1%. The day 50 moving average is 1.26 and the 200 day moving average is 1.56. The company has a market cap of $193m. You can visit the company''s website by visiting: https://www.nglenergypartners.com [stock_market_widget type="chart" template="basic" color="green" assets="NGL" range="6mo" interval="1d" axes="true" cursor="true" api="yf"] The potential market cap would be $261m based on the market concensus. NGL Energy Partners LP engages in the transportation, storage, blending... |
Do investors need to be concerned about NGL Energy Partners LP (NGL)?NGL Energy Partners LP (NYSE:NGL) closed Thursday at $1.53 per share, up from $1.40 a day earlier. While NGL Energy Partners LP has overperformed by 9.29%, investors are advised to look at stock chart patterns for technical insight. Within its last year performance, NGL fell by -31.70%, with highs and lows ranging from $2.80 to […] |
NGL ENERGY PARTNERS LP – Consensus Indicates Potential 42.9% UpsideNGL ENERGY PARTNERS LP with ticker code (NGL) now have 2 analysts in total covering the stock. The consensus rating is ''Hold''. The range between the high target price and low target price is between 2 and 2 calculating the mean target price we have 2. Now with the previous closing price of 1.4 this is indicating there is a potential upside of 42.9%. The 50 day MA is 1.25 while the 200 day moving average is 1.58. The company has a market cap of $200m. Find out more information at: https://www.nglenergypartners.com [stock_market_widget type="chart" template="basic" color="green" assets="NGL" range="6mo" interval="1d" axes="true" cursor="true" api="yf"] The potential market cap would be $286m based on the market concensus. NGL Energy Partners LP engages in the transportation, storage, bl... |
NGL Price Returns
1-mo | 32.06% |
3-mo | 11.61% |
6-mo | 6.13% |
1-year | -35.93% |
3-year | -80.18% |
5-year | -83.65% |
YTD | 42.98% |
2022 | -33.52% |
2021 | -24.17% |
2020 | -75.27% |
2019 | 34.04% |
2018 | -22.35% |
Continue Researching NGL
Here are a few links from around the web to help you further your research on NGL Energy Partners LP's stock as an investment opportunity:NGL Energy Partners LP (NGL) Stock Price | Nasdaq
NGL Energy Partners LP (NGL) Stock Quote, History and News - Yahoo Finance
NGL Energy Partners LP (NGL) Stock Price and Basic Information | MarketWatch
Loading social stream, please wait...