
NewJersey Resources Corporation (NJR): Price and Financial Metrics
NJR Price/Volume Stats
| Current price | $47.00 | 52-week high | $47.05 |
| Prev. close | $46.58 | 52-week low | $38.92 |
| Day low | $46.53 | Volume | 314,670 |
| Day high | $47.05 | Avg. volume | 511,649 |
| 50-day MA | $43.58 | Dividend yield | 3.66% |
| 200-day MA | $42.88 | Market Cap | 4.64B |
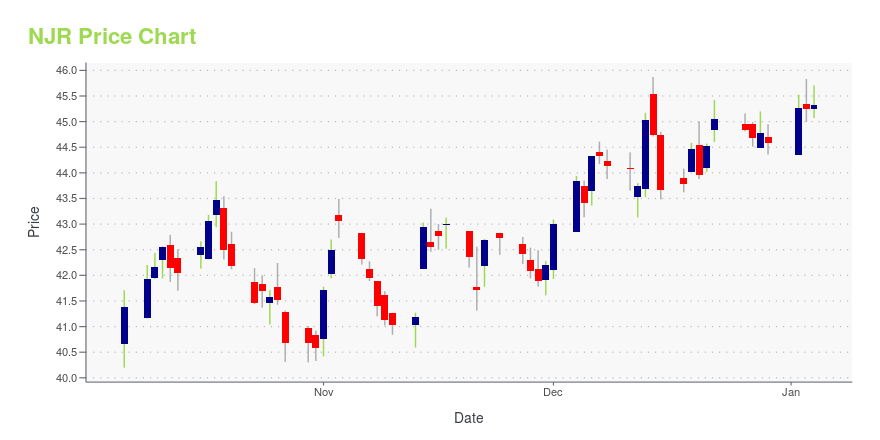
NJR Stock Price Chart Interactive Chart >
NewJersey Resources Corporation (NJR) Company Bio
New Jersey Resources is an energy services holding company that provides retail and wholesale energy services to customers primarily in the Gulf Coast, Mid-Continent, Appalachian, Northeastern, and Western market areas of the United States, as well as Canada. The company was founded in 1922 and is based in Wall, New Jersey.
Latest NJR News From Around the Web
Below are the latest news stories about NEW JERSEY RESOURCES CORP that investors may wish to consider to help them evaluate NJR as an investment opportunity.
Senior VP and COO of NJNG, Patrick Migliaccio, Sells 3,579 SharesNew Jersey Resources Corp (NYSE:NJR), a company engaged in the distribution of natural gas through a regulated utility, providing other retail and wholesale energy services, recently witnessed a transaction from a key insider. |
Reasons to Add New Jersey Resources (NJR) to Your PortfolioNew Jersey Resources (NJR) makes a strong case for investment, given its capability to increase shareholders' value, growth projections and strong ROE. |
New Jersey Resources Corp's Dividend AnalysisNew Jersey Resources Corp (NYSE:NJR) recently announced a dividend of $0.42 per share, payable on 2024-01-02, with the ex-dividend date set for 2023-12-12. As investors look forward to this upcoming payment, the spotlight also shines on the company's dividend history, yield, and growth rates. Using the data from GuruFocus, let's look into New Jersey Resources Corp's dividend performance and assess its sustainability. |
Is New Jersey Resources Corporation's (NYSE:NJR) ROE Of 13% Impressive?One of the best investments we can make is in our own knowledge and skill set. With that in mind, this article will... |
New Jersey Resources Named One of America’s Most Responsible Companies by NewsweekWALL, N.J., December 06, 2023--New Jersey Resources (NYSE: NJR) was named one of America’s Most Responsible Companies by Newsweek, and one of only 156 companies to earn this distinction for five consecutive years for its excellence and accomplishments in corporate social responsibility. NJR is among the top 600 of the nation’s largest public corporations across 14 industries recognized for their work and accomplishments on sustainability issues, performance and reputation. |
NJR Price Returns
| 1-mo | 10.82% |
| 3-mo | 9.51% |
| 6-mo | 15.37% |
| 1-year | 9.36% |
| 3-year | 31.75% |
| 5-year | 12.07% |
| YTD | 7.50% |
| 2023 | -6.94% |
| 2022 | 24.93% |
| 2021 | 19.60% |
| 2020 | -16.86% |
| 2019 | 0.13% |
NJR Dividends
| Ex-Dividend Date | Type | Payout Amount | Change | ||||||
|---|---|---|---|---|---|---|---|---|---|
| Loading, please wait... | |||||||||
Continue Researching NJR
Want to see what other sources are saying about New Jersey Resources Corp's financials and stock price? Try the links below:New Jersey Resources Corp (NJR) Stock Price | Nasdaq
New Jersey Resources Corp (NJR) Stock Quote, History and News - Yahoo Finance
New Jersey Resources Corp (NJR) Stock Price and Basic Information | MarketWatch
Loading social stream, please wait...