NXP Semiconductors N.V. (NXPI): Price and Financial Metrics
NXPI Price/Volume Stats
Current price | $247.68 | 52-week high | $264.26 |
Prev. close | $245.44 | 52-week low | $155.31 |
Day low | $245.00 | Volume | 559,087 |
Day high | $247.96 | Avg. volume | 2,397,401 |
50-day MA | $235.34 | Dividend yield | 1.69% |
200-day MA | $211.81 | Market Cap | 63.52B |
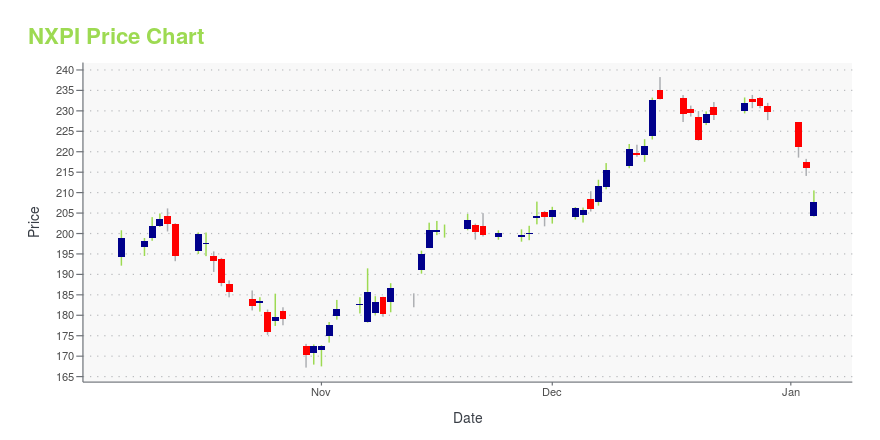
NXPI Stock Price Chart Interactive Chart >
NXPI POWR Grades
- NXPI scores best on the Momentum dimension, with a Momentum rank ahead of 86.94% of US stocks.
- The strongest trend for NXPI is in Growth, which has been heading down over the past 26 weeks.
- NXPI ranks lowest in Growth; there it ranks in the 19th percentile.
NXPI Stock Summary
- NXPI has a higher market value than 95.36% of US stocks; more precisely, its current market capitalization is $55,697,494,080.
- With a one year PEG ratio of 475.97, NXP SEMICONDUCTORS NV is expected to have a higher PEG ratio (a measure of how expensive a stock is relative to its expected earnings growth) than 92.94% of US stocks.
- Of note is the ratio of NXP SEMICONDUCTORS NV's sales and general administrative expense to its total operating expenses; only 12.81% of US stocks have a lower such ratio.
- Stocks with similar financial metrics, market capitalization, and price volatility to NXP SEMICONDUCTORS NV are ANET, CDNS, SNPS, STM, and EA.
- Visit NXPI's SEC page to see the company's official filings. To visit the company's web site, go to www.nxp.com.
NXPI Valuation Summary
- NXPI's price/sales ratio is 4.2; this is 55.56% higher than that of the median Technology stock.
- NXPI's EV/EBIT ratio has moved down 26 over the prior 162 months.
Below are key valuation metrics over time for NXPI.
Stock | Date | P/S | P/B | P/E | EV/EBIT |
---|---|---|---|---|---|
NXPI | 2023-12-08 | 4.2 | 6.5 | 19.7 | 17.0 |
NXPI | 2023-12-07 | 4.1 | 6.4 | 19.3 | 16.7 |
NXPI | 2023-12-06 | 4.0 | 6.3 | 18.8 | 16.3 |
NXPI | 2023-12-05 | 4.0 | 6.3 | 18.8 | 16.3 |
NXPI | 2023-12-04 | 4.0 | 6.3 | 18.8 | 16.3 |
NXPI | 2023-12-01 | 4.0 | 6.2 | 18.8 | 16.3 |
NXPI Growth Metrics
- Its 5 year price growth rate is now at -7.9%.
- Its 5 year revenue growth rate is now at -7.18%.
- Its 4 year price growth rate is now at -7.9%.
The table below shows NXPI's growth in key financial areas (numbers in millions of US dollars).
Date | Revenue | Operating Cash Flow | Net Income to Common Stock |
---|---|---|---|
2022-09-30 | 12,932 | 3,604 | 2,667 |
2022-06-30 | 12,348 | 3,384 | 2,448 |
2022-03-31 | 11,632 | 3,201 | 2,175 |
2021-12-31 | 11,063 | 3,077 | 1,871 |
2021-09-30 | 10,531 | 3,321 | 1,578 |
2021-06-30 | 9,937 | 2,924 | 1,037 |
NXPI's Quality Factors
The “Quality” component of the POWR Ratings focuses on 31 different factors of a companies fundamentals and operational strength. Here are some key insights as we drill into the specifics of these quality attributes.- NXPI has a Quality Grade of B, ranking ahead of 79.48% of graded US stocks.
- NXPI's asset turnover comes in at 0.527 -- ranking 136th of 208 Electronic Equipment stocks.
- QRVO, CLFD, and TDY are the stocks whose asset turnover ratios are most correlated with NXPI.
The table below shows NXPI's key quality metrics over time.
Period | Asset Turnover | Gross Margin | ROIC |
---|---|---|---|
2021-10-03 | 0.527 | 0.536 | 0.182 |
2021-07-04 | 0.491 | 0.519 | 0.127 |
2021-04-04 | 0.450 | 0.502 | 0.067 |
2020-12-31 | 0.422 | 0.492 | 0.029 |
2020-09-27 | 0.412 | 0.494 | 0.011 |
2020-06-28 | 0.411 | 0.506 | 0.029 |
NXPI Price Target
For more insight on analysts targets of NXPI, see our NXPI price target page. And for a list of of all stocks sorted by upside potential based on analyst target price, see our Top Price Target page.
Average Price Target | $234.26 | Average Broker Recommendation | 1.53 (Moderate Buy) |
NXP Semiconductors N.V. (NXPI) Company Bio
NXP Semiconductors NV is a semiconductor company. It mainly provides high-performance mixed signal and standard product solutions for automotive, identification, wireless infrastructure, industrial, mobile, consumer and computing applications. Headquartered in Eindhoven, Netherlands, NXP has locations around the globe, including offices in Asia, Europe, the Middle East, and North America. The company employs 29,000 individuals around the globe, with over 8,900 of those workers dedicated to research and development of new products. The company invests approximately 17% of its yearly revenue on research and development, focused on creating new intellectual property and solutions for its clients. Kurt Sievers has served as NXP’s President and Chief Executive Officer since May, 2020.
Latest NXPI News From Around the Web
Below are the latest news stories about NXP SEMICONDUCTORS NV that investors may wish to consider to help them evaluate NXPI as an investment opportunity.
Why These 3 EV Charging Stocks Should Be On Your Radar in 2024These EV charging stocks encompass commercial, residential and hardware sectors, making them a well-rounded suite of stock picks. |
Here's Why NXP Semiconductors (NXPI) Gained But Lagged the Market TodayIn the most recent trading session, NXP Semiconductors (NXPI) closed at $229.38, indicating a +0.02% shift from the previous trading day. |
Insider Sell Alert: EVP Human Resources Christopher Jensen Sells 7,000 Shares of NXP ...In a notable insider transaction, Christopher Jensen, the Executive Vice President of Human Resources at NXP Semiconductors NV, sold 7,000 shares of the company on December 12, 2023. |
Insider Sell Alert: EVP Global Sales Martino Ronald Sells 5,014 Shares of NXP Semiconductors NV ...In a notable insider transaction, Martino Ronald, the Executive Vice President of Global Sales at NXP Semiconductors NV (NASDAQ:NXPI), sold 5,014 shares of the company on December 11, 2023. |
NXP Semiconductors (NXPI) Stock Declines While Market Improves: Some Information for InvestorsNXP Semiconductors (NXPI) closed the most recent trading day at $219.13, moving -0.64% from the previous trading session. |
NXPI Price Returns
1-mo | 1.23% |
3-mo | 8.30% |
6-mo | 25.00% |
1-year | 41.06% |
3-year | 34.54% |
5-year | 203.06% |
YTD | 8.30% |
2023 | 48.39% |
2022 | -29.21% |
2021 | 44.83% |
2020 | 26.60% |
2019 | 75.73% |
NXPI Dividends
Ex-Dividend Date | Type | Payout Amount | Change | ||||||
---|---|---|---|---|---|---|---|---|---|
Loading, please wait... |
Loading social stream, please wait...