
New York Community Bancorp, Inc. (NYCB): Price and Financial Metrics
NYCB Price/Volume Stats
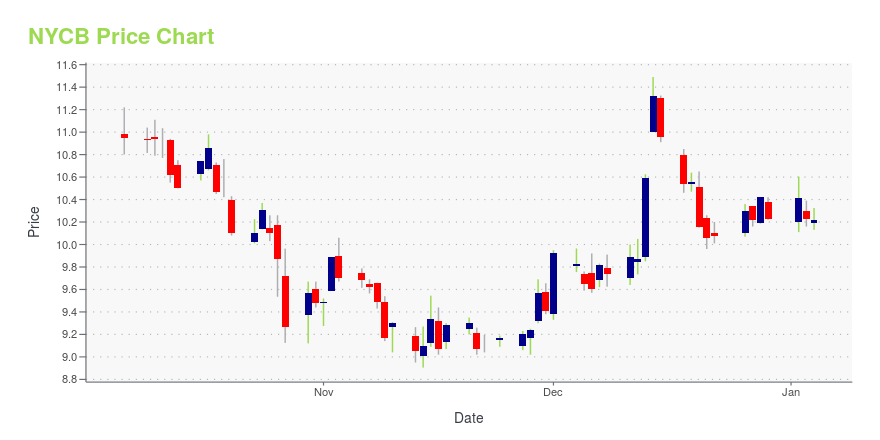
| Current price | $11.22 | 52-week high | $42.66 |
| Prev. close | $10.61 | 52-week low | $5.10 |
| Day low | $10.59 | Volume | 7,304,600 |
| Day high | $11.22 | Avg. volume | 9,278,232 |
| 50-day MA | $10.08 | Dividend yield | 1.04% |
| 200-day MA | $18.16 | Market Cap | 3.07B |
NYCB Stock Price Chart Interactive Chart >
New York Community Bancorp, Inc. (NYCB) Company Bio
New York Community Bancorp offers banking products and financial services in New York, New Jersey, Florida, Ohio, and Arizona. The company was founded in 1859 and is based in Westbury, New York.
Latest NYCB News From Around the Web
Below are the latest news stories about NEW YORK COMMUNITY BANCORP INC that investors may wish to consider to help them evaluate NYCB as an investment opportunity.
Is New York Community (NYCB) Worth a Look on 6.7% Dividend Yield?Amid the uncertain macroeconomic backdrop, it becomes difficult for investors to generate robust returns. So, they should keep an eye on high dividend-yielding stocks like New York Community (NYCB). |
Banco Santander (SAN) Buys Stake in U.S Real Estate PortfolioBanco Santander (SAN) acquires a 20% stake in a U.S. multifamily real estate loan portfolio for $1.1 billion from the FDIC, which will hold 80% in a JV with the bank. |
12 Most Profitable Cheap Stocks To BuyIn this piece, we will take a look at the 12 most profitable cheap stocks to buy. If you want to skip our coverage of the latest happenings in the renewable energy industry, then you can skip ahead to 5 Most Profitable Cheap Stocks To Buy. As investors seek to exit 2023 with the hopes […] |
Blackstone (BX), CPPIB Win Stake in Signature Bank Property LoanA joint venture between Blackstone (BX) and CPPIB wins a stake in the $17-billion portfolio of commercial property loans from the FDIC's sale of Signature Bank debt. |
New York Community Bancorp (NYCB) Soars 6.9%: Is Further Upside Left in the Stock?New York Community Bancorp (NYCB) witnessed a jump in share price last session on above-average trading volume. The latest trend in earnings estimate revisions for the stock doesn't suggest further strength down the road. |
NYCB Price Returns
| 1-mo | 23.03% |
| 3-mo | 27.15% |
| 6-mo | -63.45% |
| 1-year | -71.22% |
| 3-year | -62.83% |
| 5-year | -53.27% |
| YTD | -62.70% |
| 2023 | 26.87% |
| 2022 | -24.54% |
| 2021 | 22.67% |
| 2020 | -5.82% |
| 2019 | 35.38% |
NYCB Dividends
| Ex-Dividend Date | Type | Payout Amount | Change | ||||||
|---|---|---|---|---|---|---|---|---|---|
| Loading, please wait... | |||||||||
Continue Researching NYCB
Want to do more research on New York Community Bancorp Inc's stock and its price? Try the links below:New York Community Bancorp Inc (NYCB) Stock Price | Nasdaq
New York Community Bancorp Inc (NYCB) Stock Quote, History and News - Yahoo Finance
New York Community Bancorp Inc (NYCB) Stock Price and Basic Information | MarketWatch
Loading social stream, please wait...