
Orrstown Financial Services Inc (ORRF): Price and Financial Metrics
ORRF Price/Volume Stats
| Current price | $34.49 | 52-week high | $35.25 |
| Prev. close | $34.78 | 52-week low | $19.30 |
| Day low | $34.09 | Volume | 123,500 |
| Day high | $35.25 | Avg. volume | 72,136 |
| 50-day MA | $27.47 | Dividend yield | 2.48% |
| 200-day MA | $26.10 | Market Cap | 369.77M |
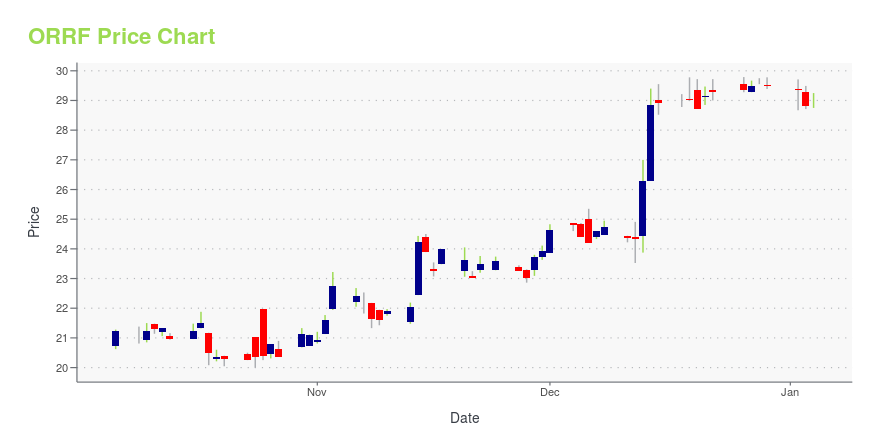
ORRF Stock Price Chart Interactive Chart >
Orrstown Financial Services Inc (ORRF) Company Bio
Orrstown Financial Services, Inc. provides commercial banking and trust services in Pennsylvania and Maryland. The company was founded in 1919 and is based in Shippensburg, Pennsylvania.
Latest ORRF News From Around the Web
Below are the latest news stories about ORRSTOWN FINANCIAL SERVICES INC that investors may wish to consider to help them evaluate ORRF as an investment opportunity.
Best Value Stocks to Buy for December 20thRWAY, KT and ORRF made it to the Zacks Rank #1 (Strong Buy) value stocks list on December 20, 2023. |
Orrstown (ORRF) Surges 8.1%: Is This an Indication of Further Gains?Orrstown (ORRF) was a big mover last session on higher-than-average trading volume. The latest trend in earnings estimate revisions might not help the stock continue moving higher in the near term. |
Orrstown Financial buying Pennsylvania rival Codorus for $207 millionThe acquisition would deepen Orrstown's presence in its home state and Maryland. In recent years, Codorus Valley Bancorp had faced pressure from an activist investor to consider selling. |
Codorus Valley to merge with Orrstown Financial in all-stock dealThe banks said on Tuesday their boards had unanimously approved the $207 million deal, under which each outstanding share of Codorus Valley common stock will be exchanged for the right to receive 0.875 shares of Orrstown common stock. Treasury Secretary Janet Yellen said in May more mergers among midsize U.S. banks could be necessary after a series of bank failures earlier this year. In July, Banc of California and PacWest Bancorp also said they will merge in an all-stock deal. |
Orrstown Financial Services, Inc. and Codorus Valley Bancorp, Inc. Announce a Merger of Equals to Create a Premier Pennsylvania and Maryland Community Banking FranchiseSHIPPENSBURG, Pa. and YORK, Pa., Dec. 12, 2023 (GLOBE NEWSWIRE) -- Orrstown Financial Services, Inc. (“Orrstown”) (NASDAQ: ORRF), the parent company of Orrstown Bank, and Codorus Valley Bancorp, Inc. (“Codorus Valley”) (NASDAQ: CVLY), the parent company of PeoplesBank, A Codorus Valley Company (“PeoplesBank”), today announced they have entered into a definitive agreement pursuant to which Codorus Valley will merge with and into Orrstown in an all-stock transaction valued at approximately $207.0 |
ORRF Price Returns
| 1-mo | 33.99% |
| 3-mo | 31.24% |
| 6-mo | 20.60% |
| 1-year | 50.69% |
| 3-year | 64.11% |
| 5-year | 87.53% |
| YTD | 18.68% |
| 2023 | 32.28% |
| 2022 | -5.26% |
| 2021 | 57.49% |
| 2020 | -23.58% |
| 2019 | 27.86% |
ORRF Dividends
| Ex-Dividend Date | Type | Payout Amount | Change | ||||||
|---|---|---|---|---|---|---|---|---|---|
| Loading, please wait... | |||||||||
Continue Researching ORRF
Want to do more research on Orrstown Financial Services Inc's stock and its price? Try the links below:Orrstown Financial Services Inc (ORRF) Stock Price | Nasdaq
Orrstown Financial Services Inc (ORRF) Stock Quote, History and News - Yahoo Finance
Orrstown Financial Services Inc (ORRF) Stock Price and Basic Information | MarketWatch
Loading social stream, please wait...