
PepsiCo, Inc. (PEP): Price and Financial Metrics
PEP Price/Volume Stats
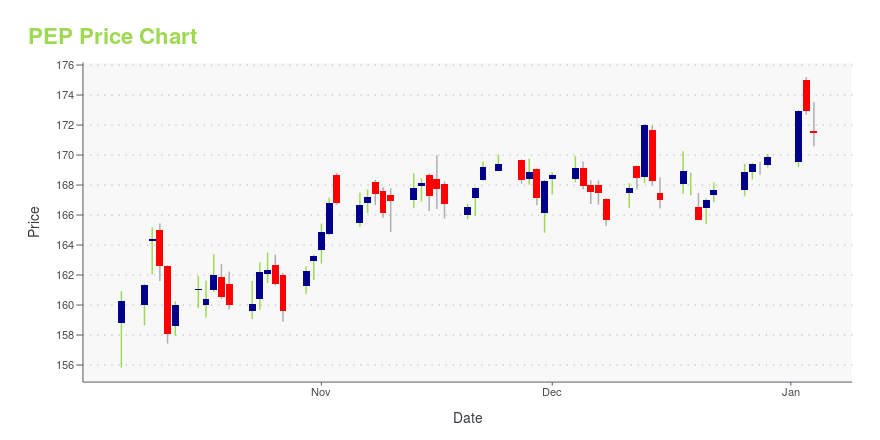
| Current price | $172.75 | 52-week high | $192.29 |
| Prev. close | $171.02 | 52-week low | $155.83 |
| Day low | $170.73 | Volume | 5,746,231 |
| Day high | $172.76 | Avg. volume | 5,529,126 |
| 50-day MA | $169.47 | Dividend yield | 3.26% |
| 200-day MA | $168.79 | Market Cap | 237.49B |
PEP Stock Price Chart Interactive Chart >
PepsiCo, Inc. (PEP) Company Bio
PepsiCo, Inc. is an American based multinational food, snack, and beverage corporation headquartered in Harrison, New York, in the hamlet of Purchase. PepsiCo's business encompasses all aspects of the food and beverage market. It oversees the manufacturing, distribution, and marketing of its products. PepsiCo was formed in 1965 with the merger of the Pepsi-Cola Company and Frito-Lay, Inc. PepsiCo has since expanded from its namesake product Pepsi Cola to an immensely diversified range of food and beverage brands. The largest and most recent acquisition was Tropicana Products in 1998 and the Quaker Oats Company in 2001, which added the Gatorade brand to the Pepsi portfolio. (Source:Wikipedia)
Latest PEP News From Around the Web
Below are the latest news stories about PEPSICO INC that investors may wish to consider to help them evaluate PEP as an investment opportunity.
Consumer Staples Sector Outlook: 3 Major Shifts Anticipated in 2024The consumer staples trends in 2024 suggest that business could be much better in 2024 due to higher volumes and elevated prices. |
The Top 7 Stocks to Buy Before They Take Off Next YearThese seven blue-chip stocks to buy can form a robust core portfolio for the next leg higher in 2024 and beyond. |
20 Most Expensive Bottled Water Brands In The WorldIn this article, we will be covering the 20 most expensive bottled water brands in the world. This article will cover recent industry trends and navigate through the major players in the industry. If you want to skip our analysis, go directly to the 5 Most Expensive Bottled Water Brands in the World. Outlook of […] |
The Zacks Analyst Blog Highlights Procter & Gamble, PepsiCo, Novartis, Occidental Petroleum and DuPont de NemoursProcter & Gamble, PepsiCo, Novartis, Occidental Petroleum and DuPont de Nemours are part of the Zacks top Analyst Blog. |
PepsiCo & 4 More Endearing Beverage Stocks Set to Cheer in 2024Beverage companies are poised to gain in 2024 from the growing demand for health and functional drinks, as well as low-alcoholic beverages. Embracing innovation and digital expansion bodes well. |
PEP Price Returns
| 1-mo | 3.60% |
| 3-mo | -0.84% |
| 6-mo | 4.52% |
| 1-year | -5.57% |
| 3-year | 18.93% |
| 5-year | 51.67% |
| YTD | 3.30% |
| 2023 | -3.29% |
| 2022 | 6.78% |
| 2021 | 20.56% |
| 2020 | 11.67% |
| 2019 | 27.38% |
PEP Dividends
| Ex-Dividend Date | Type | Payout Amount | Change | ||||||
|---|---|---|---|---|---|---|---|---|---|
| Loading, please wait... | |||||||||
Continue Researching PEP
Want to see what other sources are saying about Pepsico Inc's financials and stock price? Try the links below:Pepsico Inc (PEP) Stock Price | Nasdaq
Pepsico Inc (PEP) Stock Quote, History and News - Yahoo Finance
Pepsico Inc (PEP) Stock Price and Basic Information | MarketWatch
Loading social stream, please wait...