PennyMac Financial Services, Inc. (PFSI): Price and Financial Metrics
GET POWR RATINGS... FREE!
PFSI POWR Grades
- PFSI scores best on the Momentum dimension, with a Momentum rank ahead of 67.45% of US stocks.
- PFSI's strongest trending metric is Quality; it's been moving down over the last 179 days.
- PFSI's current lowest rank is in the Growth metric (where it is better than 0.51% of US stocks).
PFSI Stock Summary
- The price/operating cash flow metric for PENNYMAC FINANCIAL SERVICES INC is higher than just 2.8% of stocks in our set with a positive cash flow.
- As for revenue growth, note that PFSI's revenue has grown -33.47% over the past 12 months; that beats the revenue growth of merely 5.87% of US companies in our set.
- PENNYMAC FINANCIAL SERVICES INC's shareholder yield -- a measure of how much capital is returned to stockholders via dividends and buybacks -- is 116.83%, greater than the shareholder yield of 98.39% of stocks in our set.
- Stocks with similar financial metrics, market capitalization, and price volatility to PENNYMAC FINANCIAL SERVICES INC are TOL, MHO, UNTY, TMHC, and FFNW.
- PFSI's SEC filings can be seen here. And to visit PENNYMAC FINANCIAL SERVICES INC's official web site, go to ir.pennymacfinancial.com.
PFSI Valuation Summary
- PFSI's price/earnings ratio is 5.4; this is 52.63% lower than that of the median Financial Services stock.
- Over the past 118 months, PFSI's EV/EBIT ratio has gone up 10.1.
Below are key valuation metrics over time for PFSI.
Stock | Date | P/S | P/B | P/E | EV/EBIT |
---|---|---|---|---|---|
PFSI | 2023-01-23 | 1.4 | 0.9 | 5.4 | 15.6 |
PFSI | 2023-01-20 | 1.4 | 0.9 | 5.3 | 15.6 |
PFSI | 2023-01-19 | 1.3 | 0.9 | 5.1 | 15.5 |
PFSI | 2023-01-18 | 1.4 | 0.9 | 5.2 | 15.5 |
PFSI | 2023-01-17 | 1.4 | 0.9 | 5.3 | 15.6 |
PFSI | 2023-01-13 | 1.4 | 0.9 | 5.2 | 15.5 |
PFSI Growth Metrics
- Its year over year net income to common stockholders growth rate is now at -53.41%.
- Its year over year cash and equivalents growth rate is now at 10.85%.
- Its 2 year revenue growth rate is now at 47.59%.

The table below shows PFSI's growth in key financial areas (numbers in millions of US dollars).
Date | Revenue | Operating Cash Flow | Net Income to Common Stock |
---|---|---|---|
2022-09-30 | 2,339.12 | 5,336.804 | 610.973 |
2022-06-30 | 2,649.442 | 7,362.979 | 725.149 |
2022-03-31 | 2,880.179 | 8,238.441 | 800.215 |
2021-12-31 | 3,167.361 | 2,563.061 | 1,003.49 |
2021-09-30 | 3,515.696 | 494.676 | 1,283.211 |
2021-06-30 | 3,849.076 | -5,232.937 | 1,569.061 |
PFSI's Quality Factors
The “Quality” component of the POWR Ratings focuses on 31 different factors of a companies fundamentals and operational strength. Here are some key insights as we drill into the specifics of these quality attributes.- PFSI has a Quality Grade of C, ranking ahead of 59.08% of graded US stocks.
- PFSI's asset turnover comes in at 0.131 -- ranking 41st of 430 Banking stocks.
- UVSP, WFC, and MRLN are the stocks whose asset turnover ratios are most correlated with PFSI.
The table below shows PFSI's key quality metrics over time.
Period | Asset Turnover | Gross Margin | ROIC |
---|---|---|---|
2021-06-30 | 0.131 | 0.946 | 0.040 |
2021-03-31 | 0.134 | 0.940 | 0.043 |
2020-12-31 | 0.153 | 0.931 | 0.051 |
2020-09-30 | 0.167 | 0.928 | 0.055 |
2020-06-30 | 0.184 | 0.917 | 0.055 |
2020-03-31 | 0.201 | 0.910 | 0.056 |
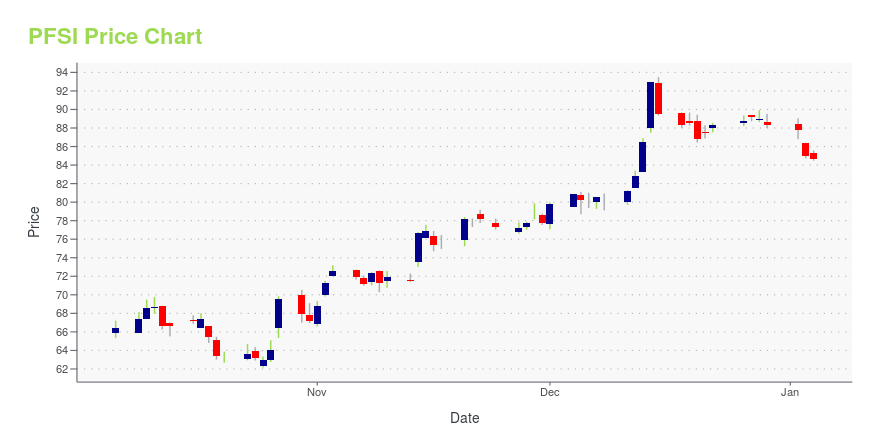
PFSI Stock Price Chart Interactive Chart >
PFSI Price/Volume Stats
Current price | $65.85 | 52-week high | $66.02 |
Prev. close | $64.26 | 52-week low | $38.53 |
Day low | $63.85 | Volume | 256,000 |
Day high | $65.86 | Avg. volume | 307,082 |
50-day MA | $58.82 | Dividend yield | 1.24% |
200-day MA | $51.84 | Market Cap | 3.30B |
PennyMac Financial Services, Inc. (PFSI) Company Bio
PennyMac Financial Services is a specialty financial services firm with a comprehensive mortgage platform and integrated business focused on the production and servicing of U.S. mortgage loans and the management of investments related to the U.S. mortgage market. The company was founded in 2008 and is based in Moorpark, California.
Latest PFSI News From Around the Web
Below are the latest news stories about PENNYMAC FINANCIAL SERVICES INC that investors may wish to consider to help them evaluate PFSI as an investment opportunity.
PennyMac Financial cut to Market Perform at JMP after recent rallyJMP analyst Trevor Cranston on Wednesday downgraded mortgage banker PennyMac Financial Services (PFSI) stock to Market Perform from Market Outperform after its roughly 50% rally since Sept |
Pennymac Commemorates a Milestone AnniversaryWESTLAKE VILLAGE, Calif., January 09, 2023--PennyMac Financial Services, Inc. (NYSE: PFSI), PennyMac Mortgage Investment Trust (NYSE: PMT) and their affiliates (collectively "Pennymac") announced today their 15-year anniversary. Reflecting on enterprise growth and success, Pennymac will commemorate its anniversary through philanthropic efforts that foster stronger community engagement and drive favorable social impact across the nation. |
PennyMac Financial Services Inc. (PFSI) is an excellent investment, but the stock is overvalued/undervalued right nowIn Friday’s session, PennyMac Financial Services Inc. (NYSE:PFSI) marked $56.75 per share, up from $55.94 in the previous session. While PennyMac Financial Services Inc. has overperformed by 1.45%, investors are advised to look at stock chart patterns for technical insight. Within its last year performance, PFSI fell by -18.88%, with highs and lows ranging from […] |
Things Could Be Looking Up for PennyMac Financial Services. Here''s Why.Is the worst over in the mortgage market? |
Things Could Be Looking Up for PennyMac Financial Services. Here's Why.Mortgage origination is a feast-and-famine business, and the boom years of 2020 and 2021 turned into a bust in 2022. Much of the volume from these years disappeared as the Federal Reserve began to hike rates, which removed the incentive for homeowners to refinance. Mortgage originators have struggled this year as well. |
PFSI Price Returns
1-mo | 16.24% |
3-mo | 20.23% |
6-mo | 21.51% |
1-year | 3.81% |
3-year | 106.84% |
5-year | 202.39% |
YTD | 16.22% |
2022 | -17.28% |
2021 | 7.69% |
2020 | 95.33% |
2019 | 60.72% |
2018 | -4.88% |
PFSI Dividends
Ex-Dividend Date | Type | Payout Amount | Change | ||||||
---|---|---|---|---|---|---|---|---|---|
Loading, please wait... |
Continue Researching PFSI
Want to do more research on PennyMac Financial Services Inc's stock and its price? Try the links below:PennyMac Financial Services Inc (PFSI) Stock Price | Nasdaq
PennyMac Financial Services Inc (PFSI) Stock Quote, History and News - Yahoo Finance
PennyMac Financial Services Inc (PFSI) Stock Price and Basic Information | MarketWatch
Loading social stream, please wait...