Procter & Gamble Co. (PG): Price and Financial Metrics

Procter & Gamble Co. (PG): $145.15

1.35 (-0.92%)

POWR Rating

Component Grades

Momentum

C

Stability

A

Sentiment

Quality

B

Add PG to Watchlist
Sign Up

Industry: Consumer Goods

Industry

C

Ranked

#12 of 53

in industry

PG Price/Volume Stats

Current price $145.15 52-week high $158.38
Prev. close $146.50 52-week low $135.83
Day low $144.52 Volume 6,385,200
Day high $146.24 Avg. volume 6,246,345
50-day MA $148.75 Dividend yield 2.56%
200-day MA $149.74 Market Cap 342.10B

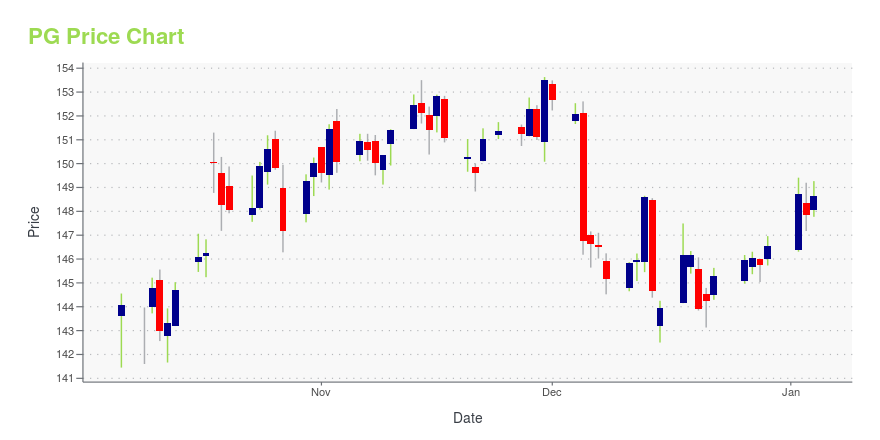
PG Stock Price Chart Interactive Chart >

PG POWR Grades

  • PG scores best on the Stability dimension, with a Stability rank ahead of 95.8% of US stocks.
  • The strongest trend for PG is in Value, which has been heading down over the past 177 days.
  • PG ranks lowest in Value; there it ranks in the 19th percentile.

PG Stock Summary

  • PG has a higher market value than 99.56% of US stocks; more precisely, its current market capitalization is $359,802,248,971.
  • PROCTER & GAMBLE CO's stock had its IPO on January 1, 1986, making it an older stock than 93.02% of US equities in our set.
  • In terms of volatility of its share price, PG is more volatile than only 0.56% of stocks we're observing.
  • Stocks that are quantitatively similar to PG, based on their financial statements, market capitalization, and price volatility, are MA, WMT, COST, JPM, and KO.
  • Visit PG's SEC page to see the company's official filings. To visit the company's web site, go to www.pginvestor.com.

PG Valuation Summary

  • In comparison to the median Consumer Defensive stock, PG's price/earnings ratio is 19.4% higher, now standing at 23.7.
  • PG's price/sales ratio has moved up 1.5 over the prior 243 months.

Below are key valuation metrics over time for PG.

Stock Date P/S P/B P/E EV/EBIT
PG 2023-11-30 4.3 7.5 23.7 19.5
PG 2023-11-29 4.3 7.4 23.4 19.2
PG 2023-11-28 4.3 7.5 23.6 19.3
PG 2023-11-27 4.3 7.4 23.4 19.2
PG 2023-11-24 4.3 7.4 23.4 19.2
PG 2023-11-22 4.3 7.4 23.4 19.2

PG Growth Metrics

    Its 5 year price growth rate is now at 37.45%.
  • Its year over year net cashflow from operations growth rate is now at -10.1%.
  • Its year over year price growth rate is now at 18.8%.
PG's revenue has moved up $9,935,000,000 over the prior 34 months.

The table below shows PG's growth in key financial areas (numbers in millions of US dollars).

Date Revenue Operating Cash Flow Net Income to Common Stock
2022-12-31 80,281 14,603 14,279
2022-09-30 80,461 16,150 14,569
2022-06-30 80,187 16,723 14,742
2022-03-31 79,618 17,131 14,596
2021-12-31 78,346 17,972 14,510
2021-09-30 77,138 18,275 14,141

PG's Quality Factors

The “Quality” component of the POWR Ratings focuses on 31 different factors of a companies fundamentals and operational strength. Here are some key insights as we drill into the specifics of these quality attributes.
  • PG has a Quality Grade of B, ranking ahead of 88.35% of graded US stocks.
  • PG's asset turnover comes in at 0.648 -- ranking 40th of 50 Consumer Goods stocks.
  • CLX, SCL, and FOSL are the stocks whose asset turnover ratios are most correlated with PG.

The table below shows PG's key quality metrics over time.

Period Asset Turnover Gross Margin ROIC
2021-09-30 0.648 0.503 0.426
2021-06-30 0.640 0.512 0.426
2021-03-31 0.627 0.516 0.427
2020-12-31 0.617 0.513 0.410
2020-09-30 0.616 0.508 0.408
2020-06-30 0.610 0.503 0.393

PG Price Target

For more insight on analysts targets of PG, see our PG price target page. And for a list of of all stocks sorted by upside potential based on analyst target price, see our Top Price Target page.

Average Price Target $153.00 Average Broker Recommendation 1.72 (Moderate Buy)

Procter & Gamble Co. (PG) Company Bio


Procter & Gamble was founded in 1837, by William Proctor and James Gamble. Headquartered in Cincinnati, Ohio, Procter & Gamble Co is a consumer goods company. The firm markets its products internationally through various channels which include mass merchandisers, grocery stores, membership club stores, drug stores, and department stores. Many of Proctor & Gamble’s products can be found in such stores as Target, Costco, Walmart, and Sam’s Club. The company sells a wide variety of products and its major and well-known brands include Olay, Old Spice, Gillette, Bounty, Bounce, Puffs, Charmin, Dawn, Febreeze, and Tide, among many others. The company has close to 100,000 employees and the current Chief Executive Officer is David S. Taylor.


PG Latest News Stream


Event/Time News Detail
Loading, please wait...

PG Latest Social Stream


Loading social stream, please wait...

View Full PG Social Stream

Latest PG News From Around the Web

Below are the latest news stories about PROCTER & GAMBLE CO that investors may wish to consider to help them evaluate PG as an investment opportunity.

Brokers Suggest Investing in P&G (PG): Read This Before Placing a Bet

The average brokerage recommendation (ABR) for P&G (PG) is equivalent to a Buy. The overly optimistic recommendations of Wall Street analysts make the effectiveness of this highly sought-after metric questionable. So, is it worth buying the stock?

Yahoo | December 4, 2023

If You Can Only Buy One Blue-Chip Stock in December, It Better Be One of These 3 Names

Are you looking to reduce your risk as an investor?

Marc Guberti on InvestorPlace | December 3, 2023

10 Monthly Dividend Stocks To Buy and Hold Forever

In this article, we discuss 10 monthly dividend stocks to buy and hold forever. You can skip our detailed analysis of dividend stocks and their performance over the years, and go directly to read 5 Monthly Dividend Stocks To Buy and Hold Forever. In recent times, dividend stocks have become increasingly popular, mainly due to […]

Yahoo | December 3, 2023

11 Best Stocks to Buy for Investment

In this piece, we will take a look at the 11 best stocks to buy for investment. If you want to skip our overview of investing and some recent financial news, then take a look at the 5 Best Stocks to Buy for Investment. As we approach the conclusion of 2023, the much-anticipated recession has […]

Yahoo | December 3, 2023

Warren Buffett sold a whopping $7B worth of stock in Q3 — and even unloaded 2 giant American 'dividend kings.' But here's why the Oracle of Omaha could be dead wrong

It's surely a bad sign for the US economy, right? Not so fast.

Yahoo | December 3, 2023

Read More 'PG' Stories Here

PG Price Returns

1-mo -3.46%
3-mo -4.49%
6-mo 1.08%
1-year -1.38%
3-year 14.63%
5-year 77.08%
YTD -1.80%
2022 -5.05%
2021 20.52%
2020 14.15%
2019 39.70%
2018 3.57%

PG Dividends

Ex-Dividend Date Type Payout Amount Change
Loading, please wait...
View Full PG Dividend History

Continue Researching PG

Here are a few links from around the web to help you further your research on PROCTER & GAMBLE Co's stock as an investment opportunity:

PROCTER & GAMBLE Co (PG) Stock Price | Nasdaq
PROCTER & GAMBLE Co (PG) Stock Quote, History and News - Yahoo Finance
PROCTER & GAMBLE Co (PG) Stock Price and Basic Information | MarketWatch

Get Free Updates

Join thousands of investors who get the latest news, insights and top rated picks from StockNews.com!