PulteGroup Inc. (PHM): Price and Financial Metrics

PulteGroup Inc. (PHM): $74.05

0.72 (-0.96%)

POWR Rating

Component Grades

Momentum

A

Stability

D

Sentiment

Quality

B

Add PHM to Watchlist
Sign Up

Industry: Homebuilders

Industry

B

Ranked

#8 of 24

in industry

PHM Price/Volume Stats

Current price $74.05 52-week high $86.15
Prev. close $74.77 52-week low $35.99
Day low $73.46 Volume 1,559,000
Day high $75.69 Avg. volume 2,683,408
50-day MA $79.92 Dividend yield 0.87%
200-day MA $65.84 Market Cap 16.25B

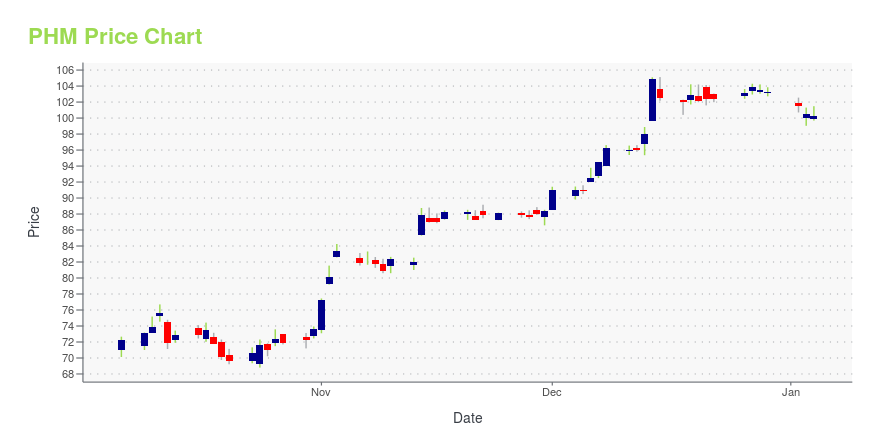
PHM Stock Price Chart Interactive Chart >

PHM POWR Grades

  • Momentum is the dimension where PHM ranks best; there it ranks ahead of 99.98% of US stocks.
  • The strongest trend for PHM is in Quality, which has been heading up over the past 177 days.
  • PHM ranks lowest in Stability; there it ranks in the 24th percentile.

PHM Stock Summary

  • PHM has a higher market value than 88.57% of US stocks; more precisely, its current market capitalization is $16,225,797,091.
  • PHM's went public 37.76 years ago, making it older than 93.16% of listed US stocks we're tracking.
  • PHM's current price/earnings ratio is 5.87, which is higher than just 10.81% of US stocks with positive earnings.
  • Stocks with similar financial metrics, market capitalization, and price volatility to PULTEGROUP INC are HUBB, J, SNA, DECK, and BEN.
  • Visit PHM's SEC page to see the company's official filings. To visit the company's web site, go to www.pultegroupinc.com.

PHM Valuation Summary

  • PHM's EV/EBIT ratio is 4.8; this is 66.08% lower than that of the median Consumer Cyclical stock.
  • PHM's EV/EBIT ratio has moved down 3.2 over the prior 243 months.

Below are key valuation metrics over time for PHM.

Stock Date P/S P/B P/E EV/EBIT
PHM 2023-09-13 1.0 1.7 6.1 4.8
PHM 2023-09-12 1.0 1.8 6.2 4.9
PHM 2023-09-11 1.1 1.8 6.5 5.1
PHM 2023-09-08 1.0 1.8 6.4 5.0
PHM 2023-09-07 1.1 1.8 6.4 5.1
PHM 2023-09-06 1.0 1.8 6.3 4.9

PHM Growth Metrics

    The 4 year net income to common stockholders growth rate now stands at 72.47%.
  • Its 3 year net cashflow from operations growth rate is now at -28.11%.
  • The 5 year price growth rate now stands at 7.52%.
PHM's revenue has moved up $5,717,752,000 over the prior 34 months.

The table below shows PHM's growth in key financial areas (numbers in millions of US dollars).

Date Revenue Operating Cash Flow Net Income to Common Stock
2022-12-31 16,229 668.466 2,617.317
2022-09-30 15,416.17 151.871 2,398.351
2022-06-30 14,951.41 674.296 2,245.972
2022-03-31 14,384.71 1,034.939 2,096.936
2021-12-31 13,926.88 1,004.021 1,946.32
2021-09-30 12,760.69 1,063.942 1,721.166

PHM's Quality Factors

The “Quality” component of the POWR Ratings focuses on 31 different factors of a companies fundamentals and operational strength. Here are some key insights as we drill into the specifics of these quality attributes.
  • PHM has a Quality Grade of B, ranking ahead of 76.12% of graded US stocks.
  • PHM's asset turnover comes in at 1.057 -- ranking 32nd of 51 Construction stocks.
  • TOL, TPH, and TPC are the stocks whose asset turnover ratios are most correlated with PHM.

The table below shows PHM's key quality metrics over time.

Period Asset Turnover Gross Margin ROIC
2021-09-30 1.057 0.266 0.173
2021-06-30 1.039 0.262 0.166
2021-03-31 0.998 0.258 0.153
2020-12-31 0.961 0.252 0.139
2020-09-30 0.977 0.246 0.132
2020-06-30 0.979 0.240 0.122

PHM Price Target

For more insight on analysts targets of PHM, see our PHM price target page. And for a list of of all stocks sorted by upside potential based on analyst target price, see our Top Price Target page.

Average Price Target $68.10 Average Broker Recommendation 1.6 (Moderate Buy)

PulteGroup Inc. (PHM) Company Bio


PulteGroup, Inc. is an American residential home construction company based in Atlanta, Georgia, United States. The company is the 3rd largest home construction company in the United States based on the number of homes closed. In total, the company has built over 775,000 homes. (Source:Wikipedia)


PHM Latest News Stream


Event/Time News Detail
Loading, please wait...

PHM Latest Social Stream


Loading social stream, please wait...

View Full PHM Social Stream

Latest PHM News From Around the Web

Below are the latest news stories about PULTEGROUP INC that investors may wish to consider to help them evaluate PHM as an investment opportunity.

Zacks.com featured highlights include Applied Materials, PulteGroup, Arcos Dorados Holdings, McKesson, and NetEase

Applied Materials, PulteGroup, Arcos Dorados Holdings, McKesson, and NetEase are part of the Zacks Screen of the Week article.

Yahoo | September 28, 2023

Higher Rates Catch Up With Home-Builder Stocks

The home-building industry had been one of the stock market’s best performers of the year until recently.

Yahoo | September 27, 2023

Homebuilder stocks feeling the heat after rising rates

The current interest rate environment is driving mortgage rates higher, which in turn are having their own effect on homebuilder stocks, such as D.R. Horton (DHI), Lennar (LEN), and PulteGroup (PHM). Many stocks across the homebuilding sector have been noted to be in a downturn since the Federal Reserve's rate pause last week. Yahoo Finance's Jared Blikre joins the show to break down how these stocks are performing amid elevated volatility. For more expert insight and the latest market action, click here to watch this full episode of Yahoo Finance Live.

Yahoo | September 27, 2023

Investors Heavily Search PulteGroup, Inc. (PHM): Here is What You Need to Know

PulteGroup (PHM) has been one of the stocks most watched by Zacks.com users lately. So, it is worth exploring what lies ahead for the stock.

Yahoo | September 27, 2023

Dive Into Dividends: Top 5 Bargain Growth Stocks to Buy

Applied Materials (AMAT), PulteGroup (PHM), Arcos Dorados (ARCO), McKesson (MCK) and NetEase (NTES) could be compelling picks for investors in the current scenario.

Yahoo | September 27, 2023

Read More 'PHM' Stories Here

PHM Price Returns

1-mo -10.20%
3-mo -4.00%
6-mo 27.29%
1-year 99.58%
3-year 61.65%
5-year 219.95%
YTD 63.79%
2022 -19.22%
2021 34.03%
2020 12.55%
2019 51.33%
2018 -20.76%

PHM Dividends

Ex-Dividend Date Type Payout Amount Change
Loading, please wait...
View Full PHM Dividend History

Get Free Updates

Join thousands of investors who get the latest news, insights and top rated picks from StockNews.com!