
Prospect Capital Corporation (PSEC): Price and Financial Metrics
PSEC Price/Volume Stats
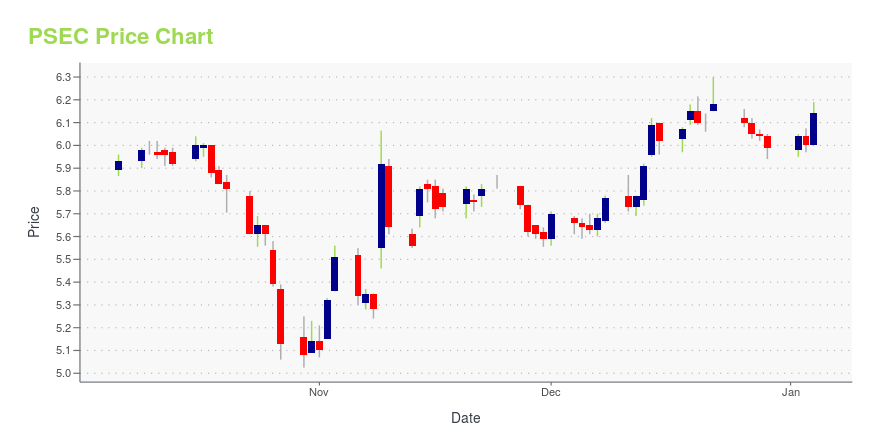
| Current price | $5.55 | 52-week high | $6.60 |
| Prev. close | $5.51 | 52-week low | $5.03 |
| Day low | $5.50 | Volume | 1,987,104 |
| Day high | $5.55 | Avg. volume | 1,864,352 |
| 50-day MA | $5.58 | Dividend yield | 12.9% |
| 200-day MA | $5.65 | Market Cap | 2.32B |
PSEC Stock Price Chart Interactive Chart >
Prospect Capital Corporation (PSEC) Company Bio
Prospect Capital Corporation invests primarily in first and second lien secured loans and unsecured debt, senior and subordinated debt and equity of companies in need of capital for acquisitions, divestitures, growth, development, recapitalizations and other purposes. The company was founded in 1988 and is based in New York, New York.
Latest PSEC News From Around the Web
Below are the latest news stories about PROSPECT CAPITAL CORP that investors may wish to consider to help them evaluate PSEC as an investment opportunity.
Prospect Capital Corp's Dividend AnalysisProspect Capital Corp (NASDAQ:PSEC) recently announced a dividend of $0.06 per share, payable on 2024-01-18, with the ex-dividend date set for 2023-12-26. As investors look forward to this upcoming payment, the spotlight also shines on the company's dividend history, yield, and growth rates. Using the data from GuruFocus, let's look into Prospect Capital Corp's dividend performance and assess its sustainability. |
Prospect Capital Announces Annual Meeting UpdateNEW YORK, Dec. 18, 2023 (GLOBE NEWSWIRE) -- Prospect Capital Corporation (NASDAQ: PSEC) (“Prospect”, “our”, or “we”) today announced that it held its annual meeting of stockholders (the “Annual Meeting”) on December 18, 2023. The proposals that were considered at the Annual Meeting are described in detail in the Company’s definitive proxy statement for the Annual Meeting as filed with the Securities and Exchange Commission on September 20, 2023 (the “Proxy”). As of September 19, 2023, there were |
Implied Volatility Surging for Prospect Capital (PSEC) Stock OptionsInvestors need to pay close attention to Prospect Capital (PSEC) stock based on the movements in the options market lately. |
Prospect Capital Corporation (NASDAQ:PSEC) Q1 2024 Earnings Call TranscriptProspect Capital Corporation (NASDAQ:PSEC) Q1 2024 Earnings Call Transcript November 10, 2023 Operator: Hello, and welcome to the Prospect Capital First Quarter Fiscal Year 2024 Earnings Release and Conference Call. All participants will be in listen-only mode. [Operator Instructions] Please note this event is being recorded. I would now like to turn the conference over […] |
Q1 2024 Prospect Capital Corp Earnings CallQ1 2024 Prospect Capital Corp Earnings Call |
PSEC Price Returns
| 1-mo | 0.36% |
| 3-mo | 7.58% |
| 6-mo | -5.39% |
| 1-year | -4.75% |
| 3-year | -7.73% |
| 5-year | 44.06% |
| YTD | -1.28% |
| 2023 | -4.13% |
| 2022 | -8.61% |
| 2021 | 70.00% |
| 2020 | -3.54% |
| 2019 | 13.83% |
PSEC Dividends
| Ex-Dividend Date | Type | Payout Amount | Change | ||||||
|---|---|---|---|---|---|---|---|---|---|
| Loading, please wait... | |||||||||
Continue Researching PSEC
Want to do more research on Prospect Capital Corp's stock and its price? Try the links below:Prospect Capital Corp (PSEC) Stock Price | Nasdaq
Prospect Capital Corp (PSEC) Stock Quote, History and News - Yahoo Finance
Prospect Capital Corp (PSEC) Stock Price and Basic Information | MarketWatch
Loading social stream, please wait...