
Pioneer Natural Resources Co. (PXD): Price and Financial Metrics
PXD Price/Volume Stats
| Current price | $269.62 | 52-week high | $278.83 |
| Prev. close | $267.66 | 52-week low | $196.74 |
| Day low | $269.14 | Volume | 4,935,200 |
| Day high | $272.23 | Avg. volume | 2,080,964 |
| 50-day MA | $257.63 | Dividend yield | 1.85% |
| 200-day MA | $238.03 | Market Cap | 62.99B |
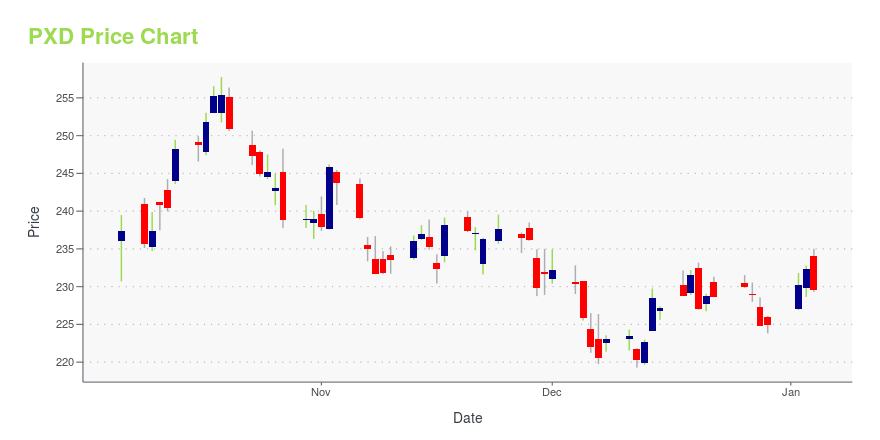
PXD Stock Price Chart Interactive Chart >
Pioneer Natural Resources Co. (PXD) Company Bio
Pioneer Natural Resources Company is an American company engaged in hydrocarbon exploration headquartered in Irving, Texas. It operates in the Cline Shale, which is part of the Spraberry Trend of the Permian Basin, where the company is the largest acreage holder. (Source:Wikipedia)
Latest PXD News From Around the Web
Below are the latest news stories about PIONEER NATURAL RESOURCES CO that investors may wish to consider to help them evaluate PXD as an investment opportunity.
Pioneer Natural Resources Company (PXD) Is a Trending Stock: Facts to Know Before Betting on ItRecently, Zacks.com users have been paying close attention to Pioneer Natural Resources (PXD). This makes it worthwhile to examine what the stock has in store. |
Pioneer Natural Resources Company (PXD) Rose with Oil PricesChartwell Investment Partners, LLC, an affiliate of Carillon Tower Advisers, Inc., released the “Carillon Chartwell Mid Cap Value Fund” third quarter 2023 investor letter. A copy of the same can be downloaded here. Equities rose early in the quarter on the back of a broader appetite for risk, however, they eventually fell when interest rates crossed 4%. […] |
Does The Energy Sector Have The Energy To Offer Good Investments?While some companies have struggled in recent years, there are opportunities for growth and attractive valuations. |
M&A market: What will it look like in 2024?The top three U.S. M&A deals of 2023 by deal value include, Exxon (XOM) acquiring Pioneer (PXD), Chevron's (CVX) acquisition of Hess (HES), and Pfizer (PFE) acquiring Seagen (SGEN), according to Dealogic. The KPMG 2024 M&A Outlook Survey found that 7 in 10 dealmakers are working currently on deals and 2 out of 3 said 2024 will be more active. KPMG Head of Deal Advisory & Strategy Carole Streicher joins Yahoo Finance Live to discuss the survey's findings and what 2024 will look like for mergers and acquisitions. "If you unpack what we think '24 is going to look like, based on the survey respondents, it's quite interesting compared to our private equity versus corporate," Streicher notes. "If you look at the first half of the year, our corporates are saying that they're going to be more a... |
Here’s What Boosted Pioneer Natural Resources Company (PXD) Share Price in Q3TimesSquare Capital Management, an equity investment management company, released its “U.S. Mid Cap Growth Strategy” third-quarter investor letter. A copy of the same can be downloaded here. In the third quarter, the strategy outperformed the Russell Midcap Growth Index and returned -4.11% (net) while the index return was -5.22%. The third quarter saw a decline in […] |
PXD Price Returns
| 1-mo | N/A |
| 3-mo | 0.28% |
| 6-mo | 18.29% |
| 1-year | 26.20% |
| 3-year | 134.94% |
| 5-year | 156.74% |
| YTD | 21.21% |
| 2023 | 5.68% |
| 2022 | 39.10% |
| 2021 | 66.33% |
| 2020 | -22.85% |
| 2019 | 16.08% |
PXD Dividends
| Ex-Dividend Date | Type | Payout Amount | Change | ||||||
|---|---|---|---|---|---|---|---|---|---|
| Loading, please wait... | |||||||||
Continue Researching PXD
Want to do more research on Pioneer Natural Resources Co's stock and its price? Try the links below:Pioneer Natural Resources Co (PXD) Stock Price | Nasdaq
Pioneer Natural Resources Co (PXD) Stock Quote, History and News - Yahoo Finance
Pioneer Natural Resources Co (PXD) Stock Price and Basic Information | MarketWatch
Loading social stream, please wait...