
Restaurant Brands International Inc. (QSR): Price and Financial Metrics
QSR Price/Volume Stats
| Current price | $67.98 | 52-week high | $83.29 |
| Prev. close | $68.57 | 52-week low | $61.77 |
| Day low | $67.97 | Volume | 1,535,064 |
| Day high | $69.59 | Avg. volume | 1,593,446 |
| 50-day MA | $69.85 | Dividend yield | 3.26% |
| 200-day MA | $73.02 | Market Cap | 21.54B |
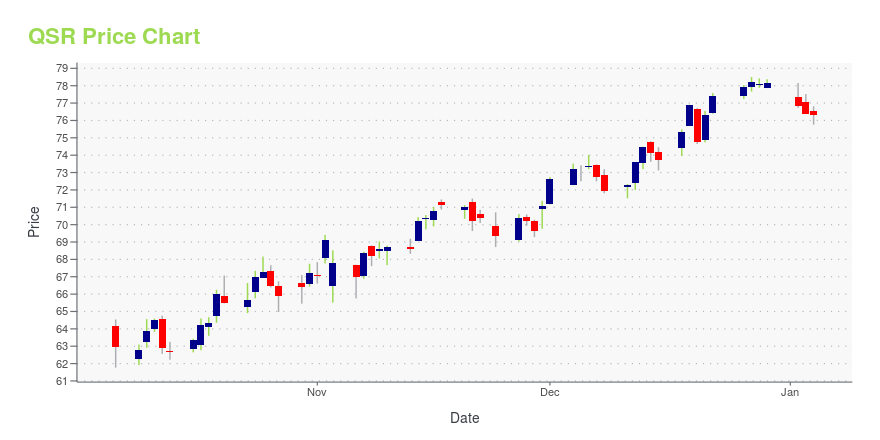
QSR Stock Price Chart Interactive Chart >
Restaurant Brands International Inc. (QSR) Company Bio
Restaurant Brands International Inc. (RBI) is a Canadian-American multinational fast food holding company. It was formed in 2014 by the $12.5 billion merger between American fast food restaurant chain Burger King and Canadian coffee shop and restaurant chain Tim Hortons, and expanded by the 2017 purchase of American fast-food chain Popeyes Louisiana Kitchen. The company is the fifth-largest operator of fast food restaurants in the world behind Subway, McDonald's, Starbucks and Yum! Brands. RBI is based alongside Tim Hortons in Toronto (previously Oakville, Ontario). For tax purposes, Burger King and Popeyes retain their existing operations and headquarters, both in Miami. The 2014 merger focused primarily on expanding the international reach of the Tim Hortons brand and providing financial efficiencies for both companies. (Source:Wikipedia)
Latest QSR News From Around the Web
Below are the latest news stories about RESTAURANT BRANDS INTERNATIONAL INC that investors may wish to consider to help them evaluate QSR as an investment opportunity.
25 Best Countries For Foodies To TravelIn this article, we take a look at the 25 best countries for foodies to travel. If you would like to skip our detailed analysis of the food service industry, you can directly go to 5 Best Countries For Foodies To Travel. Global Food Services Market: An Analysis Historically, nutritional research has mainly focused on […] |
Tims China Launches Collaboration with DiDi to Expand Customer Baseimage1 Co-branded sticker and cup sleeve image2 DiDi-themed Tims China store SHANGHAI, China, Dec. 21, 2023 (GLOBE NEWSWIRE) -- TH International Limited (“Tims China” (Nasdaq: THCH)), the exclusive operator of Tim Hortons coffee shops and Popeyes restaurants in China, has partnered with ride-hailing company DiDi Chuxing (“DiDi”) as part of a brand-building campaign. This new partnership focuses on cross-brand and cross-channel marketing, leveraging Didi’s large customer base to bolster awareness |
Restaurant Brands International Inc's Dividend AnalysisRestaurant Brands International Inc (NYSE:QSR) recently announced a dividend of $0.55 per share, payable on 2024-01-04, with the ex-dividend date set for 2023-12-20. As investors look forward to this upcoming payment, the spotlight also shines on the company's dividend history, yield, and growth rates. Using the data from GuruFocus, let's look into Restaurant Brands International Inc's dividend performance and assess its sustainability. |
Restaurant Brands International LP's Dividend AnalysisRestaurant Brands International LP (RSTRF) recently announced a dividend of $0.55 per share, payable on 2024-01-04, with the ex-dividend date set for 2023-12-20. As investors look forward to this upcoming payment, the spotlight also shines on the company's dividend history, yield, and growth rates. Using the data from GuruFocus, let's look into Restaurant Brands International LP's dividend performance and assess its sustainability. |
The deals that show how lucrative private equity can be3G’s acquisition of Burger King and the purchase of VMware have proved to be among the most profitable industry transactions |
QSR Price Returns
| 1-mo | -1.95% |
| 3-mo | -7.13% |
| 6-mo | -10.18% |
| 1-year | -8.59% |
| 3-year | 16.04% |
| 5-year | 6.53% |
| YTD | -11.62% |
| 2023 | 24.64% |
| 2022 | 10.72% |
| 2021 | 1.91% |
| 2020 | -0.34% |
| 2019 | 25.61% |
QSR Dividends
| Ex-Dividend Date | Type | Payout Amount | Change | ||||||
|---|---|---|---|---|---|---|---|---|---|
| Loading, please wait... | |||||||||
Continue Researching QSR
Want to do more research on Restaurant Brands International Inc's stock and its price? Try the links below:Restaurant Brands International Inc (QSR) Stock Price | Nasdaq
Restaurant Brands International Inc (QSR) Stock Quote, History and News - Yahoo Finance
Restaurant Brands International Inc (QSR) Stock Price and Basic Information | MarketWatch
Loading social stream, please wait...