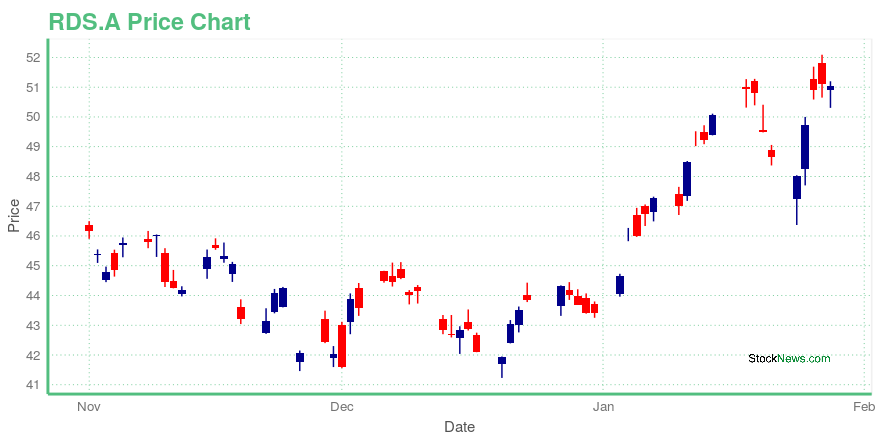
Royal Dutch Shell PLC (RDS.A): Price and Financial Metrics
RDS.A Price/Volume Stats
| Current price | $51.04 | 52-week high | $52.09 |
| Prev. close | $51.11 | 52-week low | $35.73 |
| Day low | $50.31 | Volume | 6,757,700 |
| Day high | $51.20 | Avg. volume | 5,715,584 |
| 50-day MA | $45.44 | Dividend yield | 3.76% |
| 200-day MA | $42.53 | Market Cap | 199.25B |
RDS.A Stock Price Chart Interactive Chart >
Royal Dutch Shell PLC (RDS.A) Company Bio
Royal Dutch Shell operates as an independent oil and gas company worldwide. It operates through Upstream and Downstream segments. The company was founded in 1907 and is based in The Hague, the Netherlands.
Latest RDS.A News From Around the Web
Below are the latest news stories about Shell PLC that investors may wish to consider to help them evaluate RDS.A as an investment opportunity.
Microsoft and Shell are betting on a company making greener jet fuelChicago-based start-up LanzaJet, which builds on the decade of research at LanzaTech, is scaling a potential solution to clean up the airline industry. |
Cyberattack on German oil infrastructure forces Shell to re-routeDetails at this point are limited; however, a cyberattack on German oil infrastructure companies Oiltanking Deutschland and Mabanaft forced Shell (RDS.A) to re-route oil cargoes over |
Shell to begin trading under simpler, single-line share structure(Reuters) Oil major Shell said it would begin trading with a single line of shares on Monday, confirming the assimilation of its A and B shares over the weekend as part of plans to simplify its dual share structure. |
Shell says one of the largest hydrogen electrolyzers in the world is now up and running in ChinaHydrogen has a diverse range of applications and can be deployed in a wide range of industries. |
Shells renewables boss steps down after less than two yearsBy Ron Bousso LONDON (Reuters) Shells head of renewable energies Elisabeth Brinton has stepped down less than two years after taking the reins of the business which the company seeks to rapidly grow as part of its strategy to reduce greenhouse gas emissions. |
RDS.A Price Returns
| 1-mo | N/A |
| 3-mo | N/A |
| 6-mo | N/A |
| 1-year | N/A |
| 3-year | 32.83% |
| 5-year | -9.87% |
| YTD | N/A |
| 2023 | N/A |
| 2022 | 0.00% |
| 2021 | 28.27% |
| 2020 | -37.90% |
| 2019 | 6.70% |
RDS.A Dividends
| Ex-Dividend Date | Type | Payout Amount | Change | ||||||
|---|---|---|---|---|---|---|---|---|---|
| Loading, please wait... | |||||||||
Continue Researching RDS.A
Want to do more research on Royal Dutch Shell plc's stock and its price? Try the links below:Royal Dutch Shell plc (RDS.A) Stock Price | Nasdaq
Royal Dutch Shell plc (RDS.A) Stock Quote, History and News - Yahoo Finance
Royal Dutch Shell plc (RDS.A) Stock Price and Basic Information | MarketWatch


Loading social stream, please wait...