
Roper Technologies Inc. (ROP): Price and Financial Metrics
ROP Price/Volume Stats
| Current price | $548.53 | 52-week high | $579.10 |
| Prev. close | $540.89 | 52-week low | $474.46 |
| Day low | $542.27 | Volume | 777,957 |
| Day high | $553.55 | Avg. volume | 525,928 |
| 50-day MA | $552.65 | Dividend yield | 0.52% |
| 200-day MA | $536.97 | Market Cap | 58.72B |
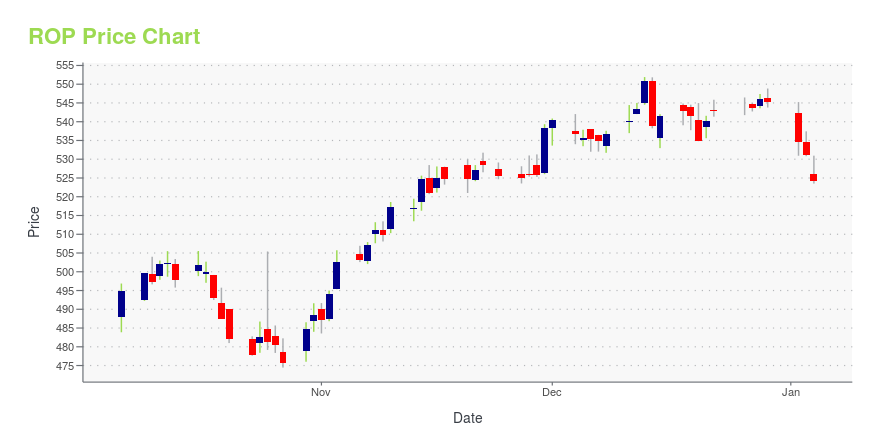
ROP Stock Price Chart Interactive Chart >
Roper Technologies Inc. (ROP) Company Bio
Roper Technologies, Inc. (formerly Roper Industries, Inc.) is an American diversified industrial company that produces engineered products for global niche markets. The company is headquartered in Sarasota, Florida. (Source:Wikipedia)
Latest ROP News From Around the Web
Below are the latest news stories about ROPER TECHNOLOGIES INC that investors may wish to consider to help them evaluate ROP as an investment opportunity.
Application Software Segment Aids Roper (ROP) Amid Cost WoesRoper (ROP) stands to benefit from the solid momentum in the Application Software unit, driven by strength across its Deltek and Aderant businesses. However, cost inflation remains a concern. |
3 High-Growth Dividend Aristocrats for Longer-Term InvestorsInvestors looking for dividend income should consider the list of Dividend Aristocrats, a group of 68 stocks in the S&P 500 Index that have each raised their dividends for at least 25 consecutive years. There are a mix of high-yield Dividend Aristocrats with lower growth prospects, which widely have appeal for investors such as retirees who are interested in higher yields. Meanwhile, investors with a longer time horizon may be more interested in high-growth Dividend Aristocrats. |
DAT Truckload Volume Index: Freight volumes closed strong in NovemberBEAVERTON, Ore.,, December 14, 2023--A post-Thanksgiving surge in truckload freight volumes made for a solid November overall compared to previous years, reported DAT Freight & Analytics, which operates the DAT One online freight marketplace and DAT iQ data analytics service. |
DAT 2024 Freight Focus report outlines the issues that will shape the year aheadBEAVERTON, Ore., December 13, 2023--Soft pricing. Unpredictable costs. Threats of fraud and cybercrime. Freight shippers, brokers and carriers are shifting tactics and accelerating the use of market data and AI-driven analytics as they grapple with a shifting business landscape, according to the 2024 Freight Focus Report from DAT Freight & Analytics. |
IntelliTrans Discusses Future Transportation Employment TrendsTyranny of the Urgent Drives Most Logistics Teams TodayATLANTA, Dec. 12, 2023 (GLOBE NEWSWIRE) -- IntelliTrans, a leader in global multimodal solutions for optimizing supply chain operations for bulk and break-bulk industries, discusses future transportation employment trends. According to the Department of Labor, 80% of the available US workforce will come from ages 65 and up by 2031. This will put more significant challenges on who in the workforce actually wants to work, adding an increased t |
ROP Price Returns
| 1-mo | -1.48% |
| 3-mo | 4.27% |
| 6-mo | 0.06% |
| 1-year | 12.29% |
| 3-year | 13.12% |
| 5-year | 54.06% |
| YTD | 1.03% |
| 2023 | 26.93% |
| 2022 | -11.64% |
| 2021 | 14.69% |
| 2020 | 22.39% |
| 2019 | 33.66% |
ROP Dividends
| Ex-Dividend Date | Type | Payout Amount | Change | ||||||
|---|---|---|---|---|---|---|---|---|---|
| Loading, please wait... | |||||||||
Continue Researching ROP
Here are a few links from around the web to help you further your research on Roper Technologies Inc's stock as an investment opportunity:Roper Technologies Inc (ROP) Stock Price | Nasdaq
Roper Technologies Inc (ROP) Stock Quote, History and News - Yahoo Finance
Roper Technologies Inc (ROP) Stock Price and Basic Information | MarketWatch
Loading social stream, please wait...