Stepan Company (SCL): Price and Financial Metrics
SCL Price/Volume Stats
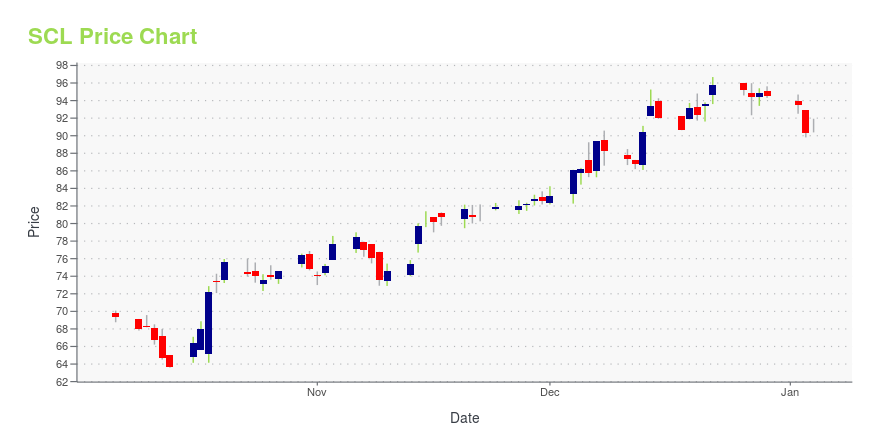
Current price | $89.34 | 52-week high | $114.97 |
Prev. close | $85.72 | 52-week low | $63.60 |
Day low | $85.27 | Volume | 93,500 |
Day high | $89.39 | Avg. volume | 114,643 |
50-day MA | $75.97 | Dividend yield | 1.74% |
200-day MA | $88.75 | Market Cap | 2.00B |
SCL Stock Price Chart Interactive Chart >
SCL POWR Grades
- SCL scores best on the Stability dimension, with a Stability rank ahead of 64.21% of US stocks.
- The strongest trend for SCL is in Stability, which has been heading down over the past 177 days.
- SCL's current lowest rank is in the Quality metric (where it is better than 12.41% of US stocks).
SCL Stock Summary
- SCL's went public 31.74 years ago, making it older than 81.34% of listed US stocks we're tracking.
- SCL's current price/earnings ratio is 35.62, which is higher than 79.46% of US stocks with positive earnings.
- As for revenue growth, note that SCL's revenue has grown -12.17% over the past 12 months; that beats the revenue growth of merely 20% of US companies in our set.
- Stocks that are quantitatively similar to SCL, based on their financial statements, market capitalization, and price volatility, are FMC, DGII, TACT, NTGR, and CTSO.
- SCL's SEC filings can be seen here. And to visit STEPAN CO's official web site, go to www.stepan.com.
SCL Valuation Summary
- SCL's price/sales ratio is 0.8; this is 38.46% lower than that of the median Basic Materials stock.
- SCL's EV/EBIT ratio has moved up 18.9 over the prior 243 months.
Below are key valuation metrics over time for SCL.
Stock | Date | P/S | P/B | P/E | EV/EBIT |
---|---|---|---|---|---|
SCL | 2023-11-29 | 0.8 | 1.5 | 35.5 | 33.3 |
SCL | 2023-11-28 | 0.8 | 1.5 | 35.2 | 33.1 |
SCL | 2023-11-27 | 0.8 | 1.5 | 35.1 | 33.1 |
SCL | 2023-11-24 | 0.8 | 1.5 | 35.1 | 33.0 |
SCL | 2023-11-22 | 0.8 | 1.5 | 35.0 | 32.9 |
SCL | 2023-11-21 | 0.7 | 1.5 | 34.6 | 32.7 |
SCL Growth Metrics
- Its 4 year revenue growth rate is now at 1.73%.
- The 3 year cash and equivalents growth rate now stands at -12.4%.
- Its year over year price growth rate is now at -25.23%.

The table below shows SCL's growth in key financial areas (numbers in millions of US dollars).
Date | Revenue | Operating Cash Flow | Net Income to Common Stock |
---|---|---|---|
2022-09-30 | 2,756.121 | 125.66 | 153.314 |
2022-06-30 | 2,639.624 | 85.592 | 150.85 |
2022-03-31 | 2,483.502 | 62.903 | 142.002 |
2021-12-31 | 2,345.966 | 72.135 | 137.804 |
2021-09-30 | 2,230.673 | 114.94 | 151.159 |
2021-06-30 | 2,092.465 | 201.411 | 147.407 |
SCL's Quality Factors
The “Quality” component of the POWR Ratings focuses on 31 different factors of a companies fundamentals and operational strength. Here are some key insights as we drill into the specifics of these quality attributes.- SCL has a Quality Grade of C, ranking ahead of 50.73% of graded US stocks.
- SCL's asset turnover comes in at 1.181 -- ranking 15th of 50 Consumer Goods stocks.
- CL, LZB, and LEG are the stocks whose asset turnover ratios are most correlated with SCL.
The table below shows SCL's key quality metrics over time.
Period | Asset Turnover | Gross Margin | ROIC |
---|---|---|---|
2021-06-30 | 1.181 | 0.204 | 0.160 |
2021-03-31 | 1.161 | 0.211 | 0.160 |
2020-12-31 | 1.165 | 0.205 | 0.152 |
2020-09-30 | 1.165 | 0.198 | 0.139 |
2020-06-30 | 1.176 | 0.188 | 0.125 |
2020-03-31 | 1.187 | 0.184 | 0.117 |
SCL Price Target
For more insight on analysts targets of SCL, see our SCL price target page. And for a list of of all stocks sorted by upside potential based on analyst target price, see our Top Price Target page.
Average Price Target | $141.50 | Average Broker Recommendation | 1.67 (Moderate Buy) |
Stepan Company (SCL) Company Bio
Stepan Chemical is a major manufacturer of specialty and intermediate chemicals used in a broad range of industries. Stepan is a leading merchant producer of surfactants, which are the key ingredients in consumer and industrial cleaning compounds. The Company is also a leading supplier of Polyurethane polyols used in the expanding thermal insulation market, and C.A.S.E. (Coatings, Adhesives, Sealants, and Elastomers) industries. The company was founded in 1932 and is based in Northfield, Illinois.
Latest SCL News From Around the Web
Below are the latest news stories about STEPAN CO that investors may wish to consider to help them evaluate SCL as an investment opportunity.
With 82% ownership, Stepan Company (NYSE:SCL) boasts of strong institutional backingKey Insights Given the large stake in the stock by institutions, Stepan's stock price might be vulnerable to their... |
Is It Too Late To Consider Buying Stepan Company (NYSE:SCL)?Stepan Company ( NYSE:SCL ), is not the largest company out there, but it led the NYSE gainers with a relatively large... |
Stepan (NYSE:SCL) Will Want To Turn Around Its Return TrendsIf you're not sure where to start when looking for the next multi-bagger, there are a few key trends you should keep an... |
Stepan (NYSE:SCL) Is Increasing Its Dividend To $0.375The board of Stepan Company ( NYSE:SCL ) has announced that the dividend on 15th of December will be increased to... |
An Intrinsic Calculation For Stepan Company (NYSE:SCL) Suggests It's 42% UndervaluedKey Insights The projected fair value for Stepan is US$127 based on 2 Stage Free Cash Flow to Equity Stepan is... |
SCL Price Returns
1-mo | 17.98% |
3-mo | 15.58% |
6-mo | -8.21% |
1-year | -18.85% |
3-year | -20.18% |
5-year | 27.08% |
YTD | -14.71% |
2022 | -12.91% |
2021 | 5.24% |
2020 | 17.75% |
2019 | 39.96% |
2018 | -5.21% |
SCL Dividends
Ex-Dividend Date | Type | Payout Amount | Change | ||||||
---|---|---|---|---|---|---|---|---|---|
Loading, please wait... |
Continue Researching SCL
Want to do more research on Stepan Co's stock and its price? Try the links below:Stepan Co (SCL) Stock Price | Nasdaq
Stepan Co (SCL) Stock Quote, History and News - Yahoo Finance
Stepan Co (SCL) Stock Price and Basic Information | MarketWatch
Loading social stream, please wait...