Stellus Capital Investment Corporation (SCM): Price and Financial Metrics
GET POWR RATINGS... FREE!
SCM POWR Grades
- Momentum is the dimension where SCM ranks best; there it ranks ahead of 94.51% of US stocks.
- SCM's strongest trending metric is Momentum; it's been moving up over the last 177 days.
- SCM's current lowest rank is in the Growth metric (where it is better than 1.82% of US stocks).
SCM Stock Summary
- The ratio of debt to operating expenses for STELLUS CAPITAL INVESTMENT CORP is higher than it is for about 99.34% of US stocks.
- In terms of volatility of its share price, SCM is more volatile than just 6.89% of stocks we're observing.
- STELLUS CAPITAL INVESTMENT CORP's shareholder yield -- a measure of how much capital is returned to stockholders via dividends and buybacks -- is 46.16%, greater than the shareholder yield of 96.85% of stocks in our set.
- If you're looking for stocks that are quantitatively similar to STELLUS CAPITAL INVESTMENT CORP, a group of peers worth examining would be TSLX, CGBD, FDUS, SLRC, and TCPC.
- Visit SCM's SEC page to see the company's official filings. To visit the company's web site, go to about.pl.
SCM Valuation Summary
- SCM's price/sales ratio is 3.9; this is 34.48% higher than that of the median Financial Services stock.
- SCM's price/sales ratio has moved down 49.2 over the prior 122 months.
Below are key valuation metrics over time for SCM.
Stock | Date | P/S | P/B | P/E | EV/EBIT |
---|---|---|---|---|---|
SCM | 2023-01-23 | 3.9 | 1 | 13.2 | 19.9 |
SCM | 2023-01-20 | 3.9 | 1 | 12.9 | 19.8 |
SCM | 2023-01-19 | 3.8 | 1 | 12.8 | 19.8 |
SCM | 2023-01-18 | 3.9 | 1 | 12.9 | 19.8 |
SCM | 2023-01-17 | 3.9 | 1 | 12.9 | 19.8 |
SCM | 2023-01-13 | 3.9 | 1 | 13.0 | 19.8 |
SCM Growth Metrics
- The 3 year revenue growth rate now stands at 16.01%.
- Its year over year net cashflow from operations growth rate is now at -151.03%.
- The 4 year revenue growth rate now stands at 51.27%.

The table below shows SCM's growth in key financial areas (numbers in millions of US dollars).
Date | Revenue | Operating Cash Flow | Net Income to Common Stock |
---|---|---|---|
2022-09-30 | 69.30313 | -66.62371 | 20.76306 |
2022-06-30 | 66.19021 | -38.49585 | 29.58615 |
2022-03-31 | 65.18553 | -81.97539 | 33.85725 |
2021-12-31 | 63.67899 | -76.10274 | 33.57287 |
2021-09-30 | 59.66082 | -117.9973 | 40.13418 |
2021-06-30 | 56.64823 | -105.6456 | 34.86424 |
SCM's Quality Factors
The “Quality” component of the POWR Ratings focuses on 31 different factors of a companies fundamentals and operational strength. Here are some key insights as we drill into the specifics of these quality attributes.- SCM has a Quality Grade of C, ranking ahead of 46.4% of graded US stocks.
- SCM's asset turnover comes in at 0.078 -- ranking 263rd of 444 Trading stocks.
- UDR, EPR, and CGBD are the stocks whose asset turnover ratios are most correlated with SCM.
The table below shows SCM's key quality metrics over time.
Period | Asset Turnover | Gross Margin | ROIC |
---|---|---|---|
2021-09-30 | 0.078 | 0.745 | 0.049 |
2021-06-30 | 0.078 | 0.761 | 0.046 |
2021-03-31 | 0.080 | 0.763 | 0.081 |
2020-12-31 | 0.085 | 0.766 | 0.036 |
2020-09-30 | 0.089 | 0.769 | 0.022 |
2020-06-30 | 0.093 | 0.761 | 0.024 |
SCM Price Target
For more insight on analysts targets of SCM, see our SCM price target page. And for a list of of all stocks sorted by upside potential based on analyst target price, see our Top Price Target page.
Average Price Target | $14.30 | Average Broker Recommendation | 1.6 (Moderate Buy) |
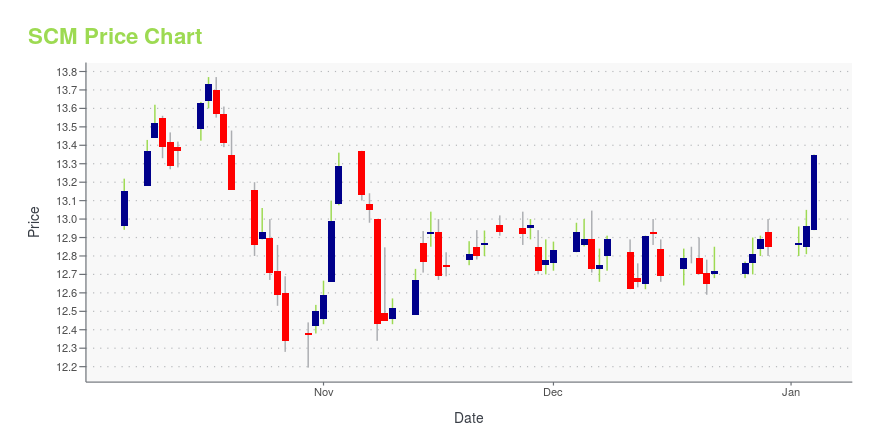
SCM Stock Price Chart Interactive Chart >
SCM Price/Volume Stats
Current price | $14.68 | 52-week high | $14.83 |
Prev. close | $14.70 | 52-week low | $11.02 |
Day low | $14.64 | Volume | 96,921 |
Day high | $14.83 | Avg. volume | 95,957 |
50-day MA | $13.52 | Dividend yield | 7.62% |
200-day MA | $13.07 | Market Cap | 286.94M |
Stellus Capital Investment Corporation (SCM) Company Bio
Stellus Capital Investment Corporation is a business development company specializing in investments in private middle-market companies. It invests through first lien, second lien, unitranche, and mezzanine debt financing, often with a corresponding equity investment. The company was founded in 2012 and is based in Houston, Texas.
Latest SCM News From Around the Web
Below are the latest news stories about STELLUS CAPITAL INVESTMENT CORP that investors may wish to consider to help them evaluate SCM as an investment opportunity.
Stellus Capital (SCM) Stock Jumps 5.2%: Will It Continue to Soar?Stellus Capital (SCM) saw its shares surge in the last session with trading volume being higher than average. The latest trend in earnings estimate revisions may not translate into further price increase in the near term. |
Stellus Capital Investment raises monthly dividend by 43% to $0.1333.Stellus Capital Investment Corporation (SCM) declares $0.40/share quarterly dividend, 43.0% increase from prior dividend of $0.28. |
Stellus Capital Investment Corporation Announces $0.40 First Quarter 2023 Regular Dividend, Payable Monthly in Increments of $0.1333 in February, March, and April 2023Stellus Capital Investment Corporation (the "Company") (NYSE: SCM) announced that its Board of Directors has declared a monthly dividend of $0.1333 for each of January, February, and March, totaling $0.40 per share in the aggregate for the first quarter of 2023. Robert T. Ladd, Chief Executive Officer of Stellus, stated, "I am pleased to announce a regular dividend for the first quarter of 2023 of $0.40 per share, in the aggregate, payable monthly. This dividend reflects a 43% increase over the |
High Yield Income: Secure Stellus Capital’s 8.4% Yield (NYSE:SCM)Stellus Capital covered its dividend payment with net investment income in Q3-22. Learn how SCM stock''s yield could rise to 9.9% for passive income investors. |
25 Highest-Paying Monthly Dividend StocksIn this article, we discuss 25 highest-paying monthly dividend stocks. You can skip our detailed analysis of dividend stocks and their returns in the past, and go directly to read 10 Highest-Paying Monthly Dividend Stocks. As high-interest rates and inflation have pulled down the market this year, dividend stocks are gaining a lot of traction […] |
SCM Price Returns
1-mo | 12.32% |
3-mo | 10.73% |
6-mo | 14.49% |
1-year | 20.40% |
3-year | 36.89% |
5-year | 88.85% |
YTD | 10.71% |
2022 | 12.87% |
2021 | 30.09% |
2020 | -14.13% |
2019 | 20.97% |
2018 | 9.54% |
SCM Dividends
Ex-Dividend Date | Type | Payout Amount | Change | ||||||
---|---|---|---|---|---|---|---|---|---|
Loading, please wait... |
Continue Researching SCM
Want to do more research on Stellus Capital Investment Corp's stock and its price? Try the links below:Stellus Capital Investment Corp (SCM) Stock Price | Nasdaq
Stellus Capital Investment Corp (SCM) Stock Quote, History and News - Yahoo Finance
Stellus Capital Investment Corp (SCM) Stock Price and Basic Information | MarketWatch
Loading social stream, please wait...