Steelcase Inc. (SCS): Price and Financial Metrics
GET POWR RATINGS... FREE!
SCS Price/Volume Stats
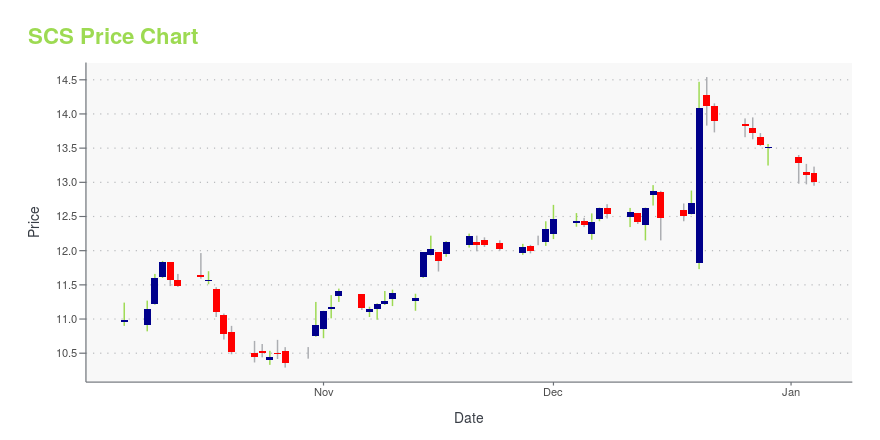
Current price | $7.11 | 52-week high | $12.43 |
Prev. close | $6.86 | 52-week low | $6.20 |
Day low | $6.85 | Volume | 897,300 |
Day high | $7.12 | Avg. volume | 840,327 |
50-day MA | $7.79 | Dividend yield | 5.83% |
200-day MA | $8.09 | Market Cap | 810.21M |
SCS Stock Price Chart Interactive Chart >
SCS POWR Grades
- SCS scores best on the Value dimension, with a Value rank ahead of 95.16% of US stocks.
- SCS's strongest trending metric is Quality; it's been moving up over the last 179 days.
- SCS's current lowest rank is in the Momentum metric (where it is better than 20.48% of US stocks).
SCS Stock Summary
- STEELCASE INC's capital turnover -- a measure of revenue relative to shareholder's equity -- is better than 86.83% of US listed stocks.
- With a price/sales ratio of 0.25, STEELCASE INC has a higher such ratio than just 8.35% of stocks in our set.
- Over the past twelve months, SCS has reported earnings growth of 193.04%, putting it ahead of 92.76% of US stocks in our set.
- If you're looking for stocks that are quantitatively similar to STEELCASE INC, a group of peers worth examining would be ACU, VPG, WOOF, PGTI, and ODP.
- SCS's SEC filings can be seen here. And to visit STEELCASE INC's official web site, go to www.steelcase.com.
SCS Valuation Summary
- In comparison to the median Industrials stock, SCS's price/sales ratio is 89.47% lower, now standing at 0.2.
- SCS's EV/EBIT ratio has moved up 23.7 over the prior 243 months.
Below are key valuation metrics over time for SCS.
Stock | Date | P/S | P/B | P/E | EV/EBIT |
---|---|---|---|---|---|
SCS | 2023-05-19 | 0.2 | 1.0 | 22.4 | 17.4 |
SCS | 2023-05-18 | 0.3 | 1.0 | 23.1 | 17.8 |
SCS | 2023-05-17 | 0.2 | 1.0 | 22.2 | 17.4 |
SCS | 2023-05-16 | 0.2 | 0.9 | 21.9 | 17.2 |
SCS | 2023-05-15 | 0.3 | 1.0 | 24.0 | 18.1 |
SCS | 2023-05-12 | 0.3 | 1.1 | 24.9 | 18.6 |
SCS Growth Metrics
- Its 2 year cash and equivalents growth rate is now at -62.87%.
- Its year over year net income to common stockholders growth rate is now at -84.67%.
- Its 2 year price growth rate is now at 13.8%.

The table below shows SCS's growth in key financial areas (numbers in millions of US dollars).
Date | Revenue | Operating Cash Flow | Net Income to Common Stock |
---|---|---|---|
2022-12-31 | 3,184 | -42.1 | 17.4 |
2022-09-30 | 3,095.3 | -115.4 | 15.6 |
2022-06-30 | 2,956.8 | -94.1 | 20.7 |
2022-03-31 | 2,772.7 | -102.6 | 4 |
2021-12-31 | 2,696.7 | -31.5 | 12.8 |
2021-09-30 | 2,576 | -41.7 | 5.3 |
SCS's Quality Factors
The “Quality” component of the POWR Ratings focuses on 31 different factors of a companies fundamentals and operational strength. Here are some key insights as we drill into the specifics of these quality attributes.- SCS has a Quality Grade of C, ranking ahead of 36.17% of graded US stocks.
- SCS's asset turnover comes in at 1.103 -- ranking 4th of 21 Business Supplies stocks.
- MLKN, HNI, and KMB are the stocks whose asset turnover ratios are most correlated with SCS.
The table below shows SCS's key quality metrics over time.
Period | Asset Turnover | Gross Margin | ROIC |
---|---|---|---|
2021-08-27 | 1.103 | 0.284 | 0.008 |
2021-05-28 | 1.128 | 0.298 | 0.039 |
2021-02-26 | 1.069 | 0.294 | 0.030 |
2020-11-27 | 1.154 | 0.306 | 0.067 |
2020-08-28 | 1.272 | 0.317 | 0.110 |
2020-05-29 | 1.350 | 0.319 | 0.107 |
SCS Price Target
For more insight on analysts targets of SCS, see our SCS price target page. And for a list of of all stocks sorted by upside potential based on analyst target price, see our Top Price Target page.
Average Price Target | $16.55 | Average Broker Recommendation | 1.33 (Strong Buy) |
Steelcase Inc. (SCS) Company Bio
Steelcase Inc. designs, manufactures, and distributes an integrated portfolio of furniture settings, user-centered technologies, and interior architectural products. The company was founded in 1912 and is based in Grand Rapids, Michigan.
Latest SCS News From Around the Web
Below are the latest news stories about STEELCASE INC that investors may wish to consider to help them evaluate SCS as an investment opportunity.
New Strong Buy Stocks for May 17thEPM, SCS, TGS, IFNNY and SWRAY have been added to the Zacks Rank #1 (Strong Buy) List on May 17, 2023. |
Best Value Stocks to Buy for May 17thEPM and SCS made it to the Zacks Rank #1 (Strong Buy) value stocks list on May 17, 2023. |
Best Income Stocks to Buy for May 17thSWRAY, EPM and SCS made it to the Zacks Rank #1 (Strong Buy) income stocks list on May 17, 2023. |
Steelcase Inc.'s (NYSE:SCS) Stock Financial Prospects Look Bleak: Should Shareholders Be Prepared For A Share Price Correction?Steelcase's (NYSE:SCS) stock up by 4.3% over the past three months. Given that the markets usually pay for the... |
New Strong Buy Stocks for May 2ndSCS, MHO, GFI, SLCA and TNET have been added to the Zacks Rank #1 (Strong Buy) List on May 2nd, 2023. |
SCS Price Returns
1-mo | -11.13% |
3-mo | -9.73% |
6-mo | -11.24% |
1-year | -39.19% |
3-year | -33.25% |
5-year | -38.53% |
YTD | 1.76% |
2022 | -36.31% |
2021 | -9.87% |
2020 | -31.43% |
2019 | 42.60% |
2018 | 1.19% |
SCS Dividends
Ex-Dividend Date | Type | Payout Amount | Change | ||||||
---|---|---|---|---|---|---|---|---|---|
Loading, please wait... |
Continue Researching SCS
Want to see what other sources are saying about Steelcase Inc's financials and stock price? Try the links below:Steelcase Inc (SCS) Stock Price | Nasdaq
Steelcase Inc (SCS) Stock Quote, History and News - Yahoo Finance
Steelcase Inc (SCS) Stock Price and Basic Information | MarketWatch
Loading social stream, please wait...