Sherwin-Williams Co. (SHW): Price and Financial Metrics


Sherwin-Williams Co. (SHW): $211.28

2.22 (+1.06%)

POWR Rating

Component Grades

Growth

S

Value

I

Momentum

G

Stability

N

Sentiment

U

Quality

P

SHW POWR Grades

  • Quality is the dimension where SHW ranks best; there it ranks ahead of 87.72% of US stocks.
  • SHW's strongest trending metric is Quality; it's been moving down over the last 179 days.
  • SHW ranks lowest in Value; there it ranks in the 23rd percentile.

SHW Stock Summary

  • SHW has a market capitalization of $54,619,191,667 -- more than approximately 96.08% of US stocks.
  • SHERWIN WILLIAMS CO's capital turnover -- a measure of revenue relative to shareholder's equity -- is better than 94.4% of US listed stocks.
  • SHW's went public 37.25 years ago, making it older than 93.52% of listed US stocks we're tracking.
  • Stocks with similar financial metrics, market capitalization, and price volatility to SHERWIN WILLIAMS CO are HUM, ITW, DG, GWW, and TGT.
  • Visit SHW's SEC page to see the company's official filings. To visit the company's web site, go to www.sherwin-williams.com.

SHW Valuation Summary

  • SHW's price/sales ratio is 2.6; this is 116.67% higher than that of the median Basic Materials stock.
  • Over the past 243 months, SHW's price/sales ratio has gone up 1.8.

Below are key valuation metrics over time for SHW.

Stock Date P/S P/B P/E EV/EBIT
SHW 2023-03-16 2.6 18.4 28.2 23.4
SHW 2023-03-15 2.5 18.0 27.7 23.0
SHW 2023-03-14 2.5 18.1 27.8 23.1
SHW 2023-03-13 2.5 17.8 27.3 22.8
SHW 2023-03-10 2.5 17.8 27.4 22.8
SHW 2023-03-09 2.5 18.1 27.8 23.1

SHW Growth Metrics

    Its 2 year net cashflow from operations growth rate is now at -13.97%.
  • The year over year price growth rate now stands at 0.9%.
  • Its 4 year net cashflow from operations growth rate is now at 48.88%.
SHW's revenue has moved up $4,142,261,000 over the prior 34 months.

The table below shows SHW's growth in key financial areas (numbers in millions of US dollars).

Date Revenue Operating Cash Flow Net Income to Common Stock
2022-12-31 22,148.9 1,919.9 2,020.1
2022-09-30 21,680.5 1,472.8 1,937.8
2022-06-30 20,779.8 1,683 1,754.9
2022-03-31 20,287.3 2,075.2 1,825.6
2021-12-31 19,944.6 2,244.6 1,864.4
2021-09-30 19,671.3 2,895.5 1,967.4

SHW's Quality Factors

The “Quality” component of the POWR Ratings focuses on 31 different factors of a companies fundamentals and operational strength. Here are some key insights as we drill into the specifics of these quality attributes.
  • SHW has a Quality Grade of A, ranking ahead of 98.4% of graded US stocks.
  • SHW's asset turnover comes in at 0.958 -- ranking 140th of 165 Retail stocks.
  • HZO, EZPW, and WINA are the stocks whose asset turnover ratios are most correlated with SHW.

The table below shows SHW's key quality metrics over time.

Period Asset Turnover Gross Margin ROIC
2021-09-30 0.958 0.447 0.199
2021-06-30 0.956 0.464 0.215
2021-03-31 0.919 0.472 0.206
2020-12-31 0.893 0.473 0.195
2020-09-30 0.873 0.470 0.180
2020-06-30 0.861 0.463 0.169

SHW Price Target

For more insight on analysts targets of SHW, see our SHW price target page. And for a list of of all stocks sorted by upside potential based on analyst target price, see our Top Price Target page.

Average Price Target $311.98 Average Broker Recommendation 1.6 (Moderate Buy)

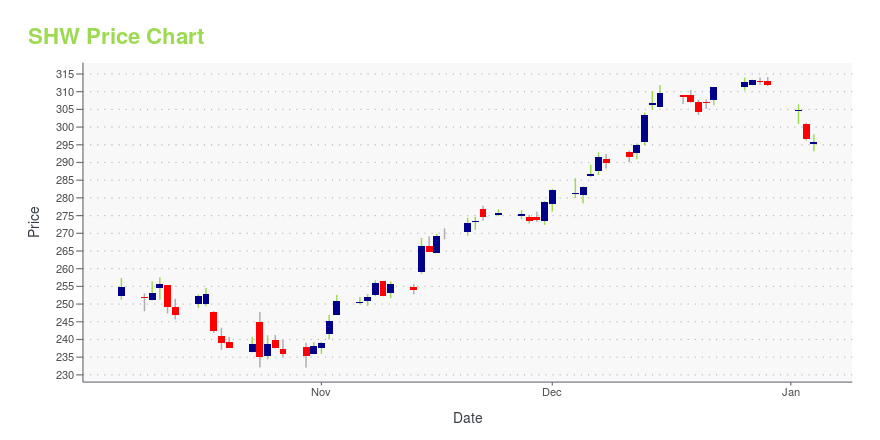
SHW Stock Price Chart Interactive Chart >

Price chart for SHW

SHW Price/Volume Stats

Current price $211.28 52-week high $285.00
Prev. close $209.06 52-week low $195.24
Day low $205.81 Volume 2,237,060
Day high $212.74 Avg. volume 1,655,856
50-day MA $228.89 Dividend yield 1.15%
200-day MA $232.74 Market Cap 54.52B

Sherwin-Williams Co. (SHW) Company Bio


Sherwin-Williams Company is an American Cleveland, Ohio–based company in the paint and coating manufacturing industry. The company primarily engages in the manufacture, distribution, and sale of paintscoatings, floorcoverings, and related products to professional, industrial, commercial, and retail customers primarily in North and South America and Europe. At the end of 2020, Sherwin-Willams had operations in over 120 countries. (Source:Wikipedia)


SHW Latest News Stream


Event/Time News Detail
Loading, please wait...

SHW Latest Social Stream


Loading social stream, please wait...

View Full SHW Social Stream

Latest SHW News From Around the Web

Below are the latest news stories about SHERWIN WILLIAMS CO that investors may wish to consider to help them evaluate SHW as an investment opportunity.

12 Future Dividend Kings in the Next 6 Years or Less

In this article, we discuss 12 future dividend kings in the next 6 years or less. You can skip our detailed analysis of dividend stocks and their returns over the years, and go directly to read 5 Future Dividend Kings in the Next 6 Years or Less. Dividend Kings are companies that have dividend growth […]

Yahoo | March 23, 2023

14 Best Dividend Aristocrat Stocks To Buy Now

In this article, we discuss 14 best dividend aristocrats to buy now. You can skip our detailed analysis of dividend investments and the performance of dividend stocks in the past, and go directly to read 5 Best Dividend Aristocrat Stocks To Buy Now. Dividend aristocrats are companies that have raised their dividends consecutively for 25 […]

Yahoo | March 21, 2023

Calculating The Intrinsic Value Of The Sherwin-Williams Company (NYSE:SHW)

Key Insights The projected fair value for Sherwin-Williams is US$212 based on 2 Stage Free Cash Flow to Equity Current...

Yahoo | March 21, 2023

At US$220, Is It Time To Put The Sherwin-Williams Company (NYSE:SHW) On Your Watch List?

Let's talk about the popular The Sherwin-Williams Company ( NYSE:SHW ). The company's shares saw significant share...

Yahoo | March 17, 2023

Insiders probably made the right decision selling US$1.0m worth of shares earlier this year as The Sherwin-Williams Company's (NYSE:SHW)) stock dips by 4.6%.

By selling US$1.0m worth of The Sherwin-Williams Company ( NYSE:SHW ) stock at an average sell price of US$235 over the...

Yahoo | March 13, 2023

Read More 'SHW' Stories Here

SHW Price Returns

1-mo -4.84%
3-mo -12.70%
6-mo 0.55%
1-year -14.62%
3-year 43.10%
5-year 70.34%
YTD -10.73%
2022 -31.96%
2021 44.66%
2020 27.05%
2019 49.70%
2018 -3.23%

SHW Dividends

Ex-Dividend Date Type Payout Amount Change
Loading, please wait...
View Full SHW Dividend History

Continue Researching SHW

Want to see what other sources are saying about Sherwin Williams Co's financials and stock price? Try the links below:

Sherwin Williams Co (SHW) Stock Price | Nasdaq
Sherwin Williams Co (SHW) Stock Quote, History and News - Yahoo Finance
Sherwin Williams Co (SHW) Stock Price and Basic Information | MarketWatch

Get Free Updates

Join thousands of investors who get the latest news, insights and top rated picks from StockNews.com!


Page generated in 0.7622 seconds.