
SI-BONE, Inc. (SIBN): Price and Financial Metrics
SIBN Price/Volume Stats
| Current price | $16.16 | 52-week high | $26.03 |
| Prev. close | $15.97 | 52-week low | $11.76 |
| Day low | $15.69 | Volume | 416,800 |
| Day high | $16.20 | Avg. volume | 404,494 |
| 50-day MA | $14.04 | Dividend yield | N/A |
| 200-day MA | $16.89 | Market Cap | 665.87M |
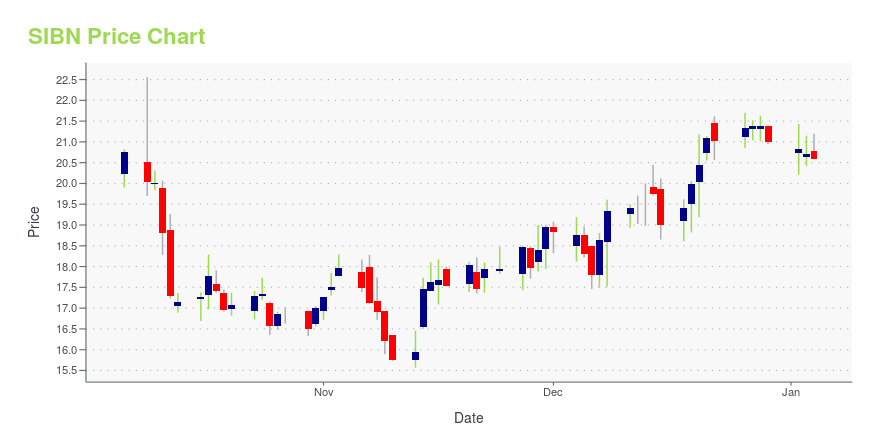
SIBN Stock Price Chart Interactive Chart >
SI-BONE, Inc. (SIBN) Company Bio
SI-BONE, Inc. engages in the development of invasive surgical implant system. Its product, iFuse, seeks to fuse the sacroiliac joint to treat sacroiliac joint dysfunction that often causes severe lower back pain. The company was founded on April 2008 by Mark A. Reiley and Jeffrey W. Dunn in and is headquartered in San Jose, CA.
Latest SIBN News From Around the Web
Below are the latest news stories about SI-BONE INC that investors may wish to consider to help them evaluate SIBN as an investment opportunity.
Si-Bone (SIBN) Crossed Above the 50-Day Moving Average: What That Means for InvestorsShould investors be excited or worried when a stock crosses above the 50-Day simple moving average? |
Insider Sell: President, Commercial Ops Anthony Recupero Sells 8,457 Shares of SI-BONE Inc (SIBN)In a recent transaction on November 17, 2023, Anthony Recupero, President of Commercial Operations at SI-BONE Inc, sold 8,457 shares of the company's stock. |
SI-BONE To Present at Piper Sandler 35th Annual Healthcare Conference on November 28, 2023SANTA CLARA, Calif., Nov. 14, 2023 (GLOBE NEWSWIRE) -- SI-BONE, Inc. (Nasdaq: SIBN), a medical device company dedicated to solving musculoskeletal disorders of the sacropelvic anatomy, today announced that the company will be participating in the upcoming Piper Sandler Healthcare Conference in New York. Management will be hosting a fireside chat on Tuesday, November 28, 2023, at 3:30 p.m. Eastern Time / 12:30 p.m. Pacific Time. Investors interested in listening to the conference call may do so b |
SI-BONE, Inc. (NASDAQ:SIBN) Q3 2023 Earnings Call TranscriptSI-BONE, Inc. (NASDAQ:SIBN) Q3 2023 Earnings Call Transcript November 6, 2023 Operator: Good afternoon and welcome to SI-BONE’s Third Quarter Earnings Conference Call. At this time, all participants are in a listen-only mode. We will be facilitating a question and answer session towards the end of today’s call. As a reminder, this call is being […] |
Q3 2023 SI-BONE Inc Earnings CallQ3 2023 SI-BONE Inc Earnings Call |
SIBN Price Returns
| 1-mo | 29.49% |
| 3-mo | 10.91% |
| 6-mo | -17.42% |
| 1-year | -35.31% |
| 3-year | -44.35% |
| 5-year | -16.70% |
| YTD | -23.01% |
| 2023 | 54.34% |
| 2022 | -38.77% |
| 2021 | -25.72% |
| 2020 | 39.07% |
| 2019 | 2.92% |
Continue Researching SIBN
Here are a few links from around the web to help you further your research on SI-BONE Inc's stock as an investment opportunity:SI-BONE Inc (SIBN) Stock Price | Nasdaq
SI-BONE Inc (SIBN) Stock Quote, History and News - Yahoo Finance
SI-BONE Inc (SIBN) Stock Price and Basic Information | MarketWatch
Loading social stream, please wait...