Southern Co. (SO): Price and Financial Metrics
GET POWR RATINGS... FREE!
SO POWR Grades
- Momentum is the dimension where SO ranks best; there it ranks ahead of 88.94% of US stocks.
- SO's strongest trending metric is Value; it's been moving down over the last 177 days.
- SO's current lowest rank is in the Value metric (where it is better than 18.7% of US stocks).
SO Stock Summary
- With a market capitalization of $73,507,189,347, SOUTHERN CO has a greater market value than 97.12% of US stocks.
- Of note is the ratio of SOUTHERN CO's sales and general administrative expense to its total operating expenses; merely 0.48% of US stocks have a lower such ratio.
- For SO, its debt to operating expenses ratio is greater than that reported by 94.04% of US equities we're observing.
- Stocks that are quantitatively similar to SO, based on their financial statements, market capitalization, and price volatility, are DUK, SRE, IBN, SCCO, and D.
- SO's SEC filings can be seen here. And to visit SOUTHERN CO's official web site, go to www.southerncompany.com.
SO Valuation Summary
- In comparison to the median Utilities stock, SO's price/sales ratio is 35% higher, now standing at 2.7.
- Over the past 243 months, SO's price/earnings ratio has gone up 6.4.
Below are key valuation metrics over time for SO.
Stock | Date | P/S | P/B | P/E | EV/EBIT |
---|---|---|---|---|---|
SO | 2023-01-13 | 2.7 | 2.2 | 22.5 | 22.0 |
SO | 2023-01-12 | 2.7 | 2.2 | 22.5 | 22.0 |
SO | 2023-01-11 | 2.8 | 2.2 | 22.9 | 22.2 |
SO | 2023-01-10 | 2.8 | 2.2 | 22.8 | 22.1 |
SO | 2023-01-09 | 2.8 | 2.2 | 22.9 | 22.2 |
SO | 2023-01-06 | 2.8 | 2.2 | 23.0 | 22.2 |
SO Growth Metrics
- Its 5 year price growth rate is now at 14.68%.
- Its 3 year net cashflow from operations growth rate is now at 5.49%.
- Its year over year net income to common stockholders growth rate is now at -32.35%.

The table below shows SO's growth in key financial areas (numbers in millions of US dollars).
Date | Revenue | Operating Cash Flow | Net Income to Common Stock |
---|---|---|---|
2022-09-30 | 27,999 | 6,105 | 3,396 |
2022-06-30 | 25,859 | 6,844 | 3,025 |
2022-03-31 | 23,851 | 6,519 | 2,290 |
2021-12-31 | 23,113 | 6,169 | 2,393 |
2021-09-30 | 22,463 | 6,557 | 2,995 |
2021-06-30 | 21,845 | 6,753 | 3,145 |
SO's Quality Factors
The “Quality” component of the POWR Ratings focuses on 31 different factors of a companies fundamentals and operational strength. Here are some key insights as we drill into the specifics of these quality attributes.- SO has a Quality Grade of C, ranking ahead of 47.28% of graded US stocks.
- SO's asset turnover comes in at 0.176 -- ranking 73rd of 105 Utilities stocks.
- ATO, ED, and AEP are the stocks whose asset turnover ratios are most correlated with SO.
The table below shows SO's key quality metrics over time.
Period | Asset Turnover | Gross Margin | ROIC |
---|---|---|---|
2021-06-30 | 0.176 | 0.413 | 0.034 |
2021-03-31 | 0.173 | 0.426 | 0.036 |
2020-12-31 | 0.168 | 0.425 | 0.035 |
2020-09-30 | 0.168 | 0.413 | 0.035 |
2020-06-30 | 0.173 | 0.413 | 0.037 |
2020-03-31 | 0.179 | 0.404 | 0.040 |
SO Price Target
For more insight on analysts targets of SO, see our SO price target page. And for a list of of all stocks sorted by upside potential based on analyst target price, see our Top Price Target page.
Average Price Target | $68.39 | Average Broker Recommendation | 1.78 (Moderate Buy) |
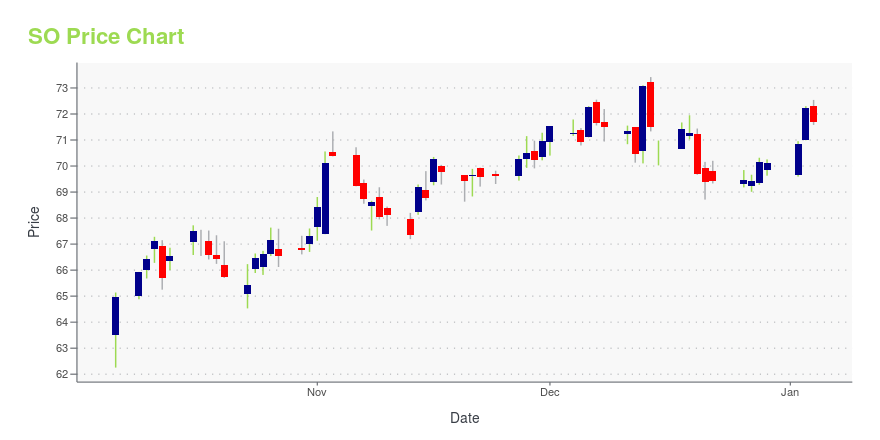
SO Stock Price Chart Interactive Chart >
SO Price/Volume Stats
Current price | $68.00 | 52-week high | $80.57 |
Prev. close | $67.52 | 52-week low | $58.85 |
Day low | $67.03 | Volume | 2,904,300 |
Day high | $68.17 | Avg. volume | 3,651,961 |
50-day MA | $68.88 | Dividend yield | 4% |
200-day MA | $71.68 | Market Cap | 74.03B |
Southern Co. (SO) Company Bio
Southern Company is an American gas and electric utility holding company based in the southern United States. It is headquartered in Atlanta, Georgia, with executive offices also located in Birmingham, Alabama. The company is currently the second largest utility company in the U.S. in terms of customer base. Through its subsidiaries it serves 9 million gas and electric utility customers in 6 states. Southern Company's regulated regional electric utilities serve a 120,000-square-mile (310,000 km2) territory with 27,000 miles (43,000 km) of distribution lines. (Source:Wikipedia)
Latest SO News From Around the Web
Below are the latest news stories about SOUTHERN CO that investors may wish to consider to help them evaluate SO as an investment opportunity.
The 7 Best Dividend Stocks to Buy for an Uncertain 2023With so many opportunities for the broader markets to go awry, investors should consider pivoting to the best dividend stocks to buy. |
Southern Co. (SO) Stock Sinks As Market Gains: What You Should KnowSouthern Co. (SO) closed at $66.86 in the latest trading session, marking a -0.39% move from the prior day. |
Southern Company to become Official Diversity, Equity and Inclusion Partner of the AJGASouthern Company and the American Junior Golf Association (AJGA) are proud to announce Southern Company as the Official Diversity, Equity and Inclusion Partner of the AJGA. The partnership will also include the Southern Company Foundation, which will support various scholarships in efforts to close the gender and diversity gaps in the sport. |
3 Dividend Stocks You Can Safely Hold for YearsMost companies currently paying dividends are equipped to do so for the foreseeable future. Only a handful of dividend-paying companies, however, are built to continue dishing out dividends into the distant unknown as unforeseen changes arise. Here's a closer look at three dividend stocks you can safely hold for years. |
Southern Company announces quarterly dividendSouthern Company today announced a regular quarterly dividend of 68 cents per share on the company's common stock, payable March 6, 2023, to shareholders of record as of Feb. 21, 2023. |
SO Price Returns
1-mo | -4.78% |
3-mo | 4.95% |
6-mo | -8.70% |
1-year | 2.45% |
3-year | 8.49% |
5-year | 89.06% |
YTD | -4.78% |
2022 | 8.24% |
2021 | 16.34% |
2020 | 0.63% |
2019 | 51.65% |
2018 | -3.75% |
SO Dividends
Ex-Dividend Date | Type | Payout Amount | Change | ||||||
---|---|---|---|---|---|---|---|---|---|
Loading, please wait... |
Continue Researching SO
Want to see what other sources are saying about Southern Co's financials and stock price? Try the links below:Southern Co (SO) Stock Price | Nasdaq
Southern Co (SO) Stock Quote, History and News - Yahoo Finance
Southern Co (SO) Stock Price and Basic Information | MarketWatch
Loading social stream, please wait...