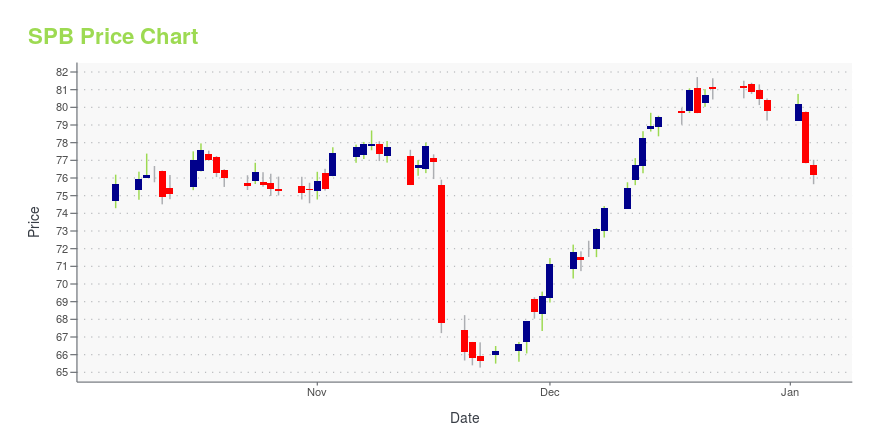
Spectrum Brands Holdings, Inc. (SPB): Price and Financial Metrics
GET POWR RATINGS... FREE!
SPB POWR Grades
- Growth is the dimension where SPB ranks best; there it ranks ahead of 48.61% of US stocks.
- The strongest trend for SPB is in Quality, which has been heading down over the past 177 days.
- SPB's current lowest rank is in the Quality metric (where it is better than 12.35% of US stocks).
SPB Stock Summary
- SPB's went public 37.1 years ago, making it older than 93.53% of listed US stocks we're tracking.
- SPB's current price/earnings ratio is 36.46, which is higher than 81.36% of US stocks with positive earnings.
- Of note is the ratio of SPECTRUM BRANDS HOLDINGS INC's sales and general administrative expense to its total operating expenses; 96.52% of US stocks have a lower such ratio.
- Stocks with similar financial metrics, market capitalization, and price volatility to SPECTRUM BRANDS HOLDINGS INC are FCFS, MNRO, AVNT, MTW, and JBT.
- Visit SPB's SEC page to see the company's official filings. To visit the company's web site, go to www.spectrumbrands.com.
SPB Valuation Summary
- In comparison to the median Consumer Defensive stock, SPB's price/sales ratio is 57.89% lower, now standing at 0.8.
- SPB's price/earnings ratio has moved up 21 over the prior 243 months.
Below are key valuation metrics over time for SPB.
Stock | Date | P/S | P/B | P/E | EV/EBIT |
---|---|---|---|---|---|
SPB | 2023-01-18 | 0.8 | 2.0 | 35.4 | 34.9 |
SPB | 2023-01-17 | 0.9 | 2.1 | 37.4 | 35.8 |
SPB | 2023-01-13 | 0.8 | 2.1 | 36.7 | 35.5 |
SPB | 2023-01-12 | 0.8 | 2.0 | 36.1 | 35.2 |
SPB | 2023-01-11 | 0.8 | 2.1 | 36.4 | 35.4 |
SPB | 2023-01-10 | 0.8 | 2.1 | 36.5 | 35.4 |
SPB Growth Metrics
- Its 4 year revenue growth rate is now at -26.05%.
- Its 5 year net income to common stockholders growth rate is now at -737.37%.
- Its 4 year cash and equivalents growth rate is now at 31.25%.

The table below shows SPB's growth in key financial areas (numbers in millions of US dollars).
Date | Revenue | Operating Cash Flow | Net Income to Common Stock |
---|---|---|---|
2022-09-30 | 3,132.5 | -85.8 | 71.6 |
2022-06-30 | 1,923.6 | 133.6 | 107 |
2022-03-31 | 2,268.4 | 153.8 | 105 |
2021-12-31 | 2,610.4 | 119.9 | 125.7 |
2021-09-30 | 2,998.1 | 280.9 | 189.6 |
2021-06-30 | 4,628.2 | 53.7 | 184.8 |
SPB's Quality Factors
The “Quality” component of the POWR Ratings focuses on 31 different factors of a companies fundamentals and operational strength. Here are some key insights as we drill into the specifics of these quality attributes.- SPB has a Quality Grade of C, ranking ahead of 33.02% of graded US stocks.
- SPB's asset turnover comes in at 0.883 -- ranking 15th of 53 Electrical Equipment stocks.
- BLDP, FCEL, and CCF are the stocks whose asset turnover ratios are most correlated with SPB.
The table below shows SPB's key quality metrics over time.
Period | Asset Turnover | Gross Margin | ROIC |
---|---|---|---|
2021-07-04 | 0.883 | 0.358 | 0.123 |
2021-04-04 | 0.862 | 0.359 | 0.163 |
2021-01-03 | 0.824 | 0.359 | 0.116 |
2020-09-30 | 0.775 | 0.346 | 0.083 |
2020-06-28 | 0.736 | 0.338 | 0.024 |
2020-03-29 | 0.737 | 0.338 | -0.027 |
SPB Price Target
For more insight on analysts targets of SPB, see our SPB price target page. And for a list of of all stocks sorted by upside potential based on analyst target price, see our Top Price Target page.
Average Price Target | $109.43 | Average Broker Recommendation | 1.36 (Strong Buy) |
SPB Stock Price Chart Interactive Chart >
SPB Price/Volume Stats
Current price | $64.75 | 52-week high | $96.13 |
Prev. close | $64.95 | 52-week low | $38.93 |
Day low | $63.81 | Volume | 174,700 |
Day high | $65.08 | Avg. volume | 600,779 |
50-day MA | $59.28 | Dividend yield | 2.59% |
200-day MA | $65.64 | Market Cap | 2.65B |
Spectrum Brands Holdings, Inc. (SPB) Company Bio
Spectrum Brands Holdings operates as a consumer products company worldwide. The company operates through Global Batteries & Appliances, Global Pet Supplies, Home and Garden Business, and Hardware & Home Improvement segments. The company was founded in 1906 and is based in Middleton, Wisconsin.
Latest SPB News From Around the Web
Below are the latest news stories about SPECTRUM BRANDS HOLDINGS INC that investors may wish to consider to help them evaluate SPB as an investment opportunity.
Spectrum Brands Holdings to Report Fiscal 2023 First Quarter Financial Results and Hold Conference Call and Webcast on February 10, 2023Spectrum Brands Holdings, Inc. (NYSE: SPB; “Spectrum Brands” or the “Company”), a leading global branded consumer products and home essentials company |
Consumer industry cross border deals total $17.8bn globally in Q3 2022Assa Abloy’s $4.3bn asset transaction deal with Spectrum Brands was the consumer industry’s biggest cross border deal of Q3 2022… The post Consumer industry cross border deals total $17.8bn globally in Q3 2022 appeared first on Just Drinks . |
Spectrum Brands Holdings – Consensus Indicates Potential 29.8% UpsideSpectrum Brands Holdings with ticker code (SPB) now have 7 analysts in total covering the stock. The consensus rating is ''Buy''. The target price ranges between 110 and 67 and has a mean target at 82.86. With the stocks previous close at 63.86 this is indicating there is a potential upside of 29.8%. There is a 50 day moving average of 53.73 and the 200 moving average now moves to 67.63. The market cap for the company is $2,570m. Find out more information at: 0 [stock_market_widget type="chart" template="basic" color="green" assets="SPB" range="6mo" interval="1d" axes="true" cursor="true" api="yf"] The potential market cap would be $3,334m based on the market concensus. 0 This article Spectrum Brands Holdings – Consensus Indicates Potential 29.8% Upside first appeared on DirectorsTalk I... |
Have you been able to find a good deal on Spectrum Brands Holdings Inc.’s shares?A share of Spectrum Brands Holdings Inc. (NYSE:SPB) closed at $60.92 per share on Friday, down from $61.24 day before. While Spectrum Brands Holdings Inc. has underperformed by -0.52%, investors are advised to look at stock chart patterns for technical insight. Within its last year performance, SPB fell by -39.13%, with highs and lows ranging […] |
Growth Endeavors to Aid Spectrum Brands (SPB) Amid InflationDespite inflation and supply-chain woes, Spectrum Brands (SPB) looks promising on robust demand, gains from GPIP, and strength in the Home & Personal Care segment. It is optimistic about fiscal 2023. |
SPB Price Returns
1-mo | 6.29% |
3-mo | 47.04% |
6-mo | -2.23% |
1-year | -25.80% |
3-year | 13.56% |
5-year | -33.52% |
YTD | 6.29% |
2022 | -38.65% |
2021 | 31.26% |
2020 | 26.75% |
2019 | 56.71% |
2018 | -58.10% |
SPB Dividends
Ex-Dividend Date | Type | Payout Amount | Change | ||||||
---|---|---|---|---|---|---|---|---|---|
Loading, please wait... |
Continue Researching SPB
Want to see what other sources are saying about Spectrum Brands Holdings Inc's financials and stock price? Try the links below:Spectrum Brands Holdings Inc (SPB) Stock Price | Nasdaq
Spectrum Brands Holdings Inc (SPB) Stock Quote, History and News - Yahoo Finance
Spectrum Brands Holdings Inc (SPB) Stock Price and Basic Information | MarketWatch
Loading social stream, please wait...