
Simon Property Group Inc. (SPG): Price and Financial Metrics
SPG Price/Volume Stats
| Current price | $152.45 | 52-week high | $158.50 |
| Prev. close | $149.31 | 52-week low | $102.11 |
| Day low | $149.79 | Volume | 1,032,400 |
| Day high | $153.25 | Avg. volume | 1,475,108 |
| 50-day MA | $149.76 | Dividend yield | 5.1% |
| 200-day MA | $140.37 | Market Cap | 49.69B |
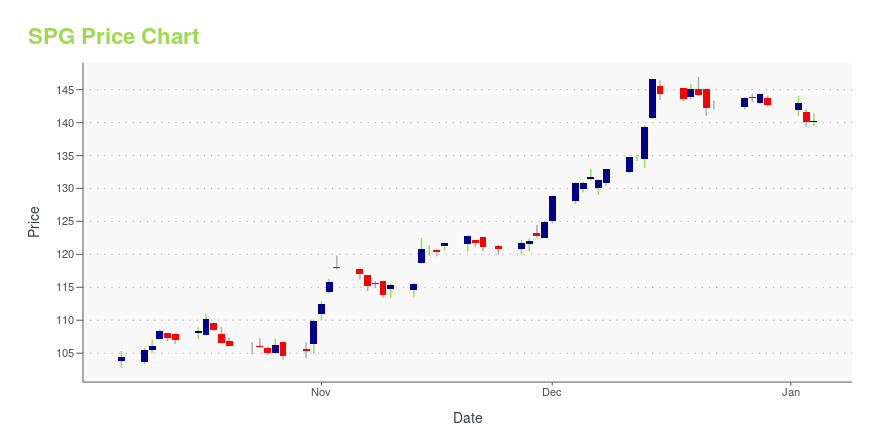
SPG Stock Price Chart Interactive Chart >
Simon Property Group Inc. (SPG) Company Bio
Simon Property Group, Inc. is an American real estate investment trust that invests in shopping malls, outlet centers, and community/lifestyle centers. It is the largest owner of shopping malls in the United States and is headquartered in Indianapolis, Indiana. Worldwide, it owns interests in 232 properties comprising approximately 241,000,000 square feet (22,400,000 m2)[needs update] of gross leasable area in North America and Asia. For a list of notable properties owned by the company, see List of Simon Property Group properties. (Source:Wikipedia)
Latest SPG News From Around the Web
Below are the latest news stories about SIMON PROPERTY GROUP INC that investors may wish to consider to help them evaluate SPG as an investment opportunity.
Simon Property (SPG) Up 33% in 3 Months: Will the Trend Last?Healthy demand for its premier properties amid a solid retail environment and focus on developing mixed-use assets are likely to drive Simon Property's (SPG) stock in the forthcoming quarters. |
Eli Lilly cut to Outperform at Daiwa Securities: 4 big analyst cutsHere is your Pro Recap of the biggest analyst cuts you may have missed since yesterday: downgrades at Eli Lilly, Simon Property Group, Wendy's, and Chipotle Mexican Grill. Daiwa Securities downgraded Eli Lilly (NYSE:LLY) to Outperform from Buy with a price target of $610.00, as reported in real-time on InvestingPro. This price target implies a nearly 7% upside from the closing price on Wednesday. Earlier this week, Eli Lilly announced the extension of its tender offer for acquiring all outstanding shares of POINT Biopharma Global (NASDAQ:PNT) at $12.50 per share in cash. |
Simon Property (SPG) Beats Stock Market Upswing: What Investors Need to KnowIn the closing of the recent trading day, Simon Property (SPG) stood at $145.16, denoting a +1.07% change from the preceding trading day. |
Should You Retain Simon Property (SPG) Stock Right Now?Simon Property (SPG) is poised to benefit from its portfolio of premium assets, a focus on omnichannel retailing and strategic buyouts, though higher e-commerce adoption and high rates are worrisome. |
Simon Property (SPG) Stock Slides as Market Rises: Facts to Know Before You TradeSimon Property (SPG) reachead $143.62 at the closing of the latest trading day, reflecting a -0.51% change compared to its last close. |
SPG Price Returns
| 1-mo | 3.29% |
| 3-mo | 8.50% |
| 6-mo | 10.22% |
| 1-year | 31.22% |
| 3-year | 43.62% |
| 5-year | 28.58% |
| YTD | 9.69% |
| 2023 | 29.24% |
| 2022 | -21.91% |
| 2021 | 95.72% |
| 2020 | -38.64% |
| 2019 | -6.74% |
SPG Dividends
| Ex-Dividend Date | Type | Payout Amount | Change | ||||||
|---|---|---|---|---|---|---|---|---|---|
| Loading, please wait... | |||||||||
Continue Researching SPG
Want to see what other sources are saying about Simon Property Group Inc's financials and stock price? Try the links below:Simon Property Group Inc (SPG) Stock Price | Nasdaq
Simon Property Group Inc (SPG) Stock Quote, History and News - Yahoo Finance
Simon Property Group Inc (SPG) Stock Price and Basic Information | MarketWatch
Loading social stream, please wait...