
Sapiens International Corporation N.V. (SPNS): Price and Financial Metrics
SPNS Price/Volume Stats
| Current price | $39.71 | 52-week high | $41.22 |
| Prev. close | $39.49 | 52-week low | $24.39 |
| Day low | $39.48 | Volume | 131,400 |
| Day high | $40.06 | Avg. volume | 135,071 |
| 50-day MA | $35.20 | Dividend yield | 1.37% |
| 200-day MA | $30.23 | Market Cap | 2.19B |
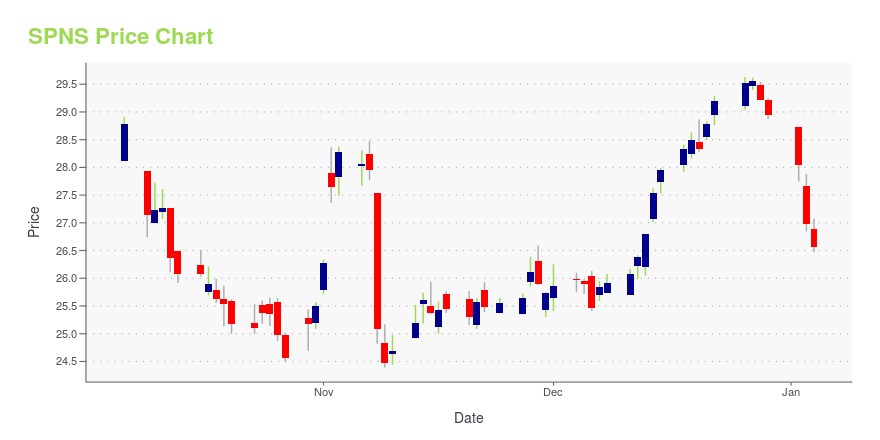
SPNS Stock Price Chart Interactive Chart >
Sapiens International Corporation N.V. (SPNS) Company Bio
Sapiens International Corporation is a provider of software solutions for the insurance industry, with a focus on the financial services sector. The Company's software solutions portfolio consists of Life, Pension, Annuity and Retirement Solutions. The company was founded in 1982 and is based in Holon, Israel.
Latest SPNS News From Around the Web
Below are the latest news stories about SAPIENS INTERNATIONAL CORP N V that investors may wish to consider to help them evaluate SPNS as an investment opportunity.
European Automotive Leader Goes Live with Sapiens IDITSuite for Auto InsuranceSapiens International Corporation, (NASDAQ: SPNS) (TASE: SPNS), a leading global provider of software solutions for the insurance industry, today announced that a leading European automotive brand has gone live with Sapiens IDITSuite and Sapiens Cloud and Application Management Services for the company's self-guarantee and warranty insurance lines of business. |
Sapiens International (SPNS) Aids Insurers With New LaunchesThe launch of Sapiens IllustrationPro and Sapiens ApplicationPro expands Sapiens International's (SPNS) portfolio. |
Sapiens to Participate in the 26th Annual Needham Growth Conference on January 17 & 18, 2024Sapiens International Corporation, (NASDAQ: SPNS) (TASE: SPNS), a leading global provider of software solutions for the insurance industry, today announced that management is scheduled to attend the 26th Annual Needham Growth Conference on January 17 and 18, 2024 in New York City. On behalf of the company, Mr. Roni Giladi, Chief Financial Officer, and Ms. Cohen-Ifrah, Chief Marketing Officer and Head of Investor Relations, will participate in a fireside chat at 1:30 p.m. Eastern time in meeting |
Sapiens Releases Latest Version of IllustrationPro and ApplicationPro with Enhanced Digital EngagementSapiens International Corporation, (NASDAQ: SPNS) (TASE: SPNS), a leading global provider of software solutions for the insurance industry, announced the launch of its latest version of Sapiens IllustrationPro and Sapiens ApplicationPro. This new release brings a multitude of enhancements and additions, all designed to empower insurers with innovation, improved member servicing, and reinforced security measures. |
Sapiens Wins Two Celent XCelent Awards and Recognized as ''Luminary" for IllustrationPro for Life & AnnuitiesSapiens International Corporation, (NASDAQ: SPNS) (TASE: SPNS), a leading global provider of software solutions for the insurance industry, announced today that Sapiens IllustrationPro for Life & Annuities has won two of Celent's 2023 XCelent awards, in the Breadth of Functionality and Customer Base and Support categories in the North America region. Sapiens has also been recognized as a "Luminary" solution. |
SPNS Price Returns
| 1-mo | 19.61% |
| 3-mo | 26.87% |
| 6-mo | 42.76% |
| 1-year | 55.22% |
| 3-year | 71.13% |
| 5-year | 156.11% |
| YTD | 38.42% |
| 2023 | 59.36% |
| 2022 | -45.01% |
| 2021 | 13.51% |
| 2020 | 33.84% |
| 2019 | 108.52% |
SPNS Dividends
| Ex-Dividend Date | Type | Payout Amount | Change | ||||||
|---|---|---|---|---|---|---|---|---|---|
| Loading, please wait... | |||||||||
Continue Researching SPNS
Want to do more research on Sapiens International Corp N V's stock and its price? Try the links below:Sapiens International Corp N V (SPNS) Stock Price | Nasdaq
Sapiens International Corp N V (SPNS) Stock Quote, History and News - Yahoo Finance
Sapiens International Corp N V (SPNS) Stock Price and Basic Information | MarketWatch
Loading social stream, please wait...