Sempra (SRE): Price and Financial Metrics
SRE Price/Volume Stats
Current price | $71.96 | 52-week high | $84.13 |
Prev. close | $73.33 | 52-week low | $68.27 |
Day low | $71.94 | Volume | 2,501,100 |
Day high | $73.55 | Avg. volume | 2,447,975 |
50-day MA | $72.32 | Dividend yield | 3.24% |
200-day MA | $75.29 | Market Cap | 45.28B |
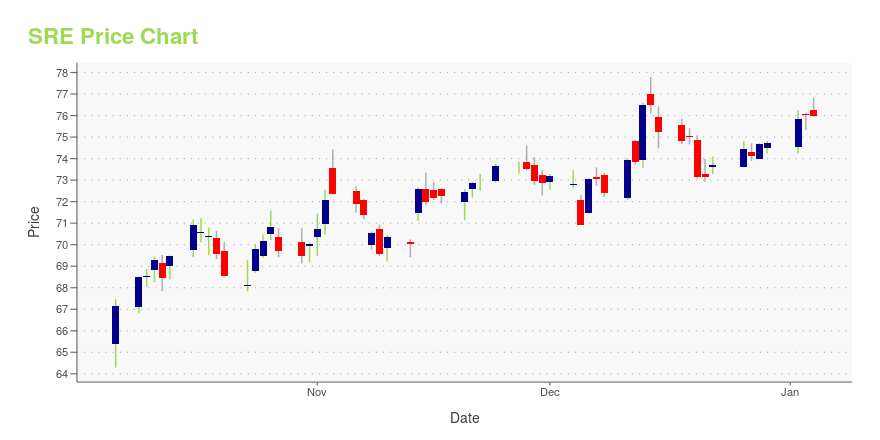
SRE Stock Price Chart Interactive Chart >
SRE POWR Grades
- SRE scores best on the Stability dimension, with a Stability rank ahead of 66.62% of US stocks.
- The strongest trend for SRE is in Momentum, which has been heading down over the past 179 days.
- SRE ranks lowest in Value; there it ranks in the 7th percentile.
SRE Stock Summary
- With a market capitalization of $46,260,367,126, SEMPRA has a greater market value than 95.02% of US stocks.
- Of note is the ratio of SEMPRA's sales and general administrative expense to its total operating expenses; merely 0.26% of US stocks have a lower such ratio.
- The ratio of debt to operating expenses for SEMPRA is higher than it is for about 92.54% of US stocks.
- Stocks that are quantitatively similar to SRE, based on their financial statements, market capitalization, and price volatility, are D, EXC, AEP, O, and PCG.
- Visit SRE's SEC page to see the company's official filings. To visit the company's web site, go to www.sempra.com.
SRE Valuation Summary
- In comparison to the median Utilities stock, SRE's price/earnings ratio is 8.87% lower, now standing at 18.5.
- Over the past 243 months, SRE's price/sales ratio has gone up 1.8.
Below are key valuation metrics over time for SRE.
Stock | Date | P/S | P/B | P/E | EV/EBIT |
---|---|---|---|---|---|
SRE | 2023-09-14 | 2.7 | 1.7 | 18.5 | 17.1 |
SRE | 2023-09-13 | 2.7 | 1.6 | 18.1 | 16.8 |
SRE | 2023-09-12 | 2.6 | 1.6 | 18.0 | 16.7 |
SRE | 2023-09-11 | 2.6 | 1.6 | 17.9 | 16.7 |
SRE | 2023-09-08 | 2.6 | 1.6 | 18.0 | 16.7 |
SRE | 2023-09-07 | 2.6 | 1.6 | 17.8 | 16.6 |
SRE Growth Metrics
- Its year over year cash and equivalents growth rate is now at 225.96%.
- Its year over year net cashflow from operations growth rate is now at 42.23%.
- The year over year price growth rate now stands at 18.93%.

The table below shows SRE's growth in key financial areas (numbers in millions of US dollars).
Date | Revenue | Operating Cash Flow | Net Income to Common Stock |
---|---|---|---|
2022-09-30 | 14,828 | 2,316 | 2,260 |
2022-06-30 | 14,224 | 3,951 | 1,127 |
2022-03-31 | 13,418 | 3,947 | 992 |
2021-12-31 | 12,857 | 3,842 | 1,254 |
2021-09-30 | 12,184 | 3,943 | 1,064 |
2021-06-30 | 11,815 | 3,819 | 2,063 |
SRE's Quality Factors
The “Quality” component of the POWR Ratings focuses on 31 different factors of a companies fundamentals and operational strength. Here are some key insights as we drill into the specifics of these quality attributes.- SRE has a Quality Grade of C, ranking ahead of 26.43% of graded US stocks.
- SRE's asset turnover comes in at 0.175 -- ranking 74th of 105 Utilities stocks.
- FE, MGEE, and AWK are the stocks whose asset turnover ratios are most correlated with SRE.
The table below shows SRE's key quality metrics over time.
Period | Asset Turnover | Gross Margin | ROIC |
---|---|---|---|
2021-06-30 | 0.175 | 0.425 | 0.047 |
2021-03-31 | 0.172 | 0.445 | 0.071 |
2020-12-31 | 0.168 | 0.443 | 0.066 |
2020-09-30 | 0.165 | 0.441 | 0.066 |
2020-06-30 | 0.169 | 0.465 | 0.072 |
2020-03-31 | 0.168 | 0.454 | 0.046 |
SRE Price Target
For more insight on analysts targets of SRE, see our SRE price target page. And for a list of of all stocks sorted by upside potential based on analyst target price, see our Top Price Target page.
Average Price Target | $151.03 | Average Broker Recommendation | 1.66 (Moderate Buy) |
Sempra (SRE) Company Bio
Sempra is a North American energy infrastructure company based in San Diego, California. Sempra's focus is on electric and natural gas infrastructure. Its operating companies include: Southern California Gas Company and San Diego Gas & Electric in Southern California; Oncor Electric Delivery Company headquarters in Texas; Sempra Liquefied natural gas|LNG; and IEnova. (Source:Wikipedia)
Latest SRE News From Around the Web
Below are the latest news stories about SEMPRA that investors may wish to consider to help them evaluate SRE as an investment opportunity.
3 Stocks to Buy as Rate-Cut Hopes Power Them HigherExploring a dynamic market landscape, these are the stocks to buy for interest rate cuts, offering both resilience and potential upside. |
Sempra Energy (SRE) Fell as Defensive Sectors Went Out of FavorClearBridge Investments, an investment management company, released its “ClearBridge Large Cap Value Strategy” second quarter 2023 investor letter. A copy of the same can be downloaded here. The strategy outperformed its Russell 1000 Value Index benchmark in the second quarter. The strategy benefited from nine of the 11 sectors in which it was invested for […] |
The 3 Most Undervalued Utilities Stocks to Buy in September 2023While the marketing pitch for undervalued utilities stocks isn’t exactly riveting stuff, this arena deserves a much closer look. |
Sempra Infrastructure sells 42% stake in Port Arthur LNG Phase 1Sempra Infrastructure, a subsidiary of California-based Sempra Energy (NYSE: SRE), has completed the sale of a large stake in its Port Arthur LNG Phase 1 project to New York-based investment company KKR & Co. Inc. (NYSE: KKR). |
Sempra Infrastructure Completes Sale of Non-Controlling Interest in Port Arthur LNG Phase 1 to KKRSempra Infrastructure, a subsidiary of Sempra (NYSE: SRE) (BMV: SRE), today announced that it has completed the sale of a 42% indirect, non-controlling interest in its Port Arthur LNG Phase 1 project to KKR. The transaction, which closed in accordance with the terms previously disclosed, results in Sempra Infrastructure retaining a controlling 28% indirect interest in Phase 1 at the project level, and ConocoPhillips owning the remaining 30% interest. |
SRE Price Returns
1-mo | 0.14% |
3-mo | 0.53% |
6-mo | 1.21% |
1-year | -10.62% |
3-year | 32.61% |
5-year | 44.84% |
YTD | -5.73% |
2022 | 20.30% |
2021 | 7.39% |
2020 | -12.78% |
2019 | 44.00% |
2018 | 4.49% |
SRE Dividends
Ex-Dividend Date | Type | Payout Amount | Change | ||||||
---|---|---|---|---|---|---|---|---|---|
Loading, please wait... |
Continue Researching SRE
Here are a few links from around the web to help you further your research on Sempra Energy's stock as an investment opportunity:Sempra Energy (SRE) Stock Price | Nasdaq
Sempra Energy (SRE) Stock Quote, History and News - Yahoo Finance
Sempra Energy (SRE) Stock Price and Basic Information | MarketWatch
Loading social stream, please wait...