Scorpio Tankers Inc. Common Shares (STNG): Price and Financial Metrics
STNG Price/Volume Stats
| Current price | $72.69 | 52-week high | $84.67 |
| Prev. close | $73.46 | 52-week low | $42.92 |
| Day low | $72.41 | Volume | 547,100 |
| Day high | $73.95 | Avg. volume | 973,902 |
| 50-day MA | $79.49 | Dividend yield | 2.09% |
| 200-day MA | $68.28 | Market Cap | 3.97B |
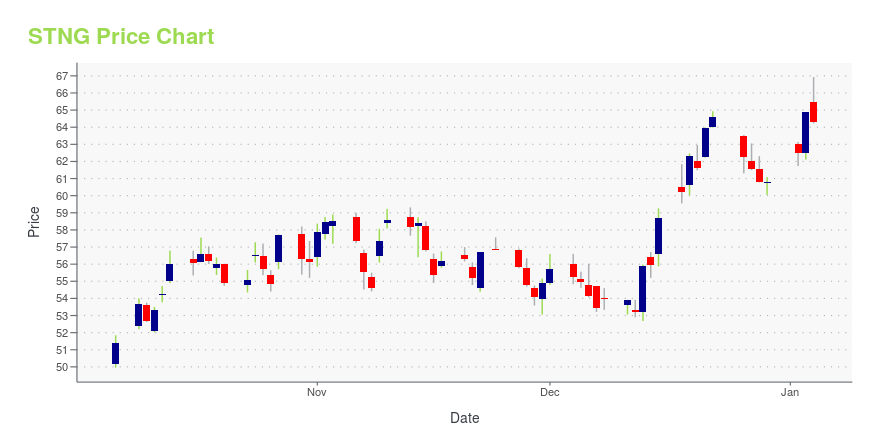
STNG Stock Price Chart Interactive Chart >
Scorpio Tankers Inc. Common Shares (STNG) Company Bio
Scorpio Tankers engages in the seaborne transportation of refined petroleum products and crude oil worldwide. The company was founded in 2009 and is based in Monaco, Monaco.
Latest STNG News From Around the Web
Below are the latest news stories about SCORPIO TANKERS INC that investors may wish to consider to help them evaluate STNG as an investment opportunity.
Why Investors Need to Take Advantage of These 2 Transportation Stocks NowThe Zacks Earnings ESP is a great way to find potential earnings surprises. Why investors should take advantage now. |
Institutional investors have a lot riding on Scorpio Tankers Inc. (NYSE:STNG) with 64% ownershipKey Insights Significantly high institutional ownership implies Scorpio Tankers' stock price is sensitive to their... |
Is Ardmore Shipping (ASC) Stock Undervalued Right Now?Here at Zacks, our focus is on the proven Zacks Rank system, which emphasizes earnings estimates and estimate revisions to find great stocks. Nevertheless, we are always paying attention to the latest value, growth, and momentum trends to underscore strong picks. |
10 Very Cheap Energy Stocks Ready To ExplodeIn this piece, we will take a look at ten very cheap energy stocks ready to explode. If you want to skip our overview of the energy industry and the latest news, then you can take a look at 5 Very Cheap Energy Stocks Ready To Explode. The global energy industry, despite a growing focus […] |
Scorpio Tankers Inc. Announces Updates on Fourth Quarter 2023 Daily TCE Revenues and Debt and Lease ActivityMONACO, Dec. 13, 2023 (GLOBE NEWSWIRE) -- Scorpio Tankers Inc. (NYSE:STNG) (“Scorpio Tankers,” or the “Company”) announces updates on fourth quarter of 2023 Daily TCE Revenues and recent debt and lease activity. Fourth Quarter of 2023 Daily Time Charter Equivalent (“TCE”) Revenues Below is a summary of the estimated average daily Time Charter Equivalent (“TCE”) revenue and duration of contracted voyages and time charters for the Company’s vessels (both in the pools and outside of the pools) thus |
STNG Price Returns
| 1-mo | -12.98% |
| 3-mo | 0.40% |
| 6-mo | 3.88% |
| 1-year | 61.87% |
| 3-year | 361.81% |
| 5-year | 207.41% |
| YTD | 20.88% |
| 2023 | 15.40% |
| 2022 | 325.48% |
| 2021 | 17.40% |
| 2020 | -70.74% |
| 2019 | 128.49% |
STNG Dividends
| Ex-Dividend Date | Type | Payout Amount | Change | ||||||
|---|---|---|---|---|---|---|---|---|---|
| Loading, please wait... | |||||||||
Continue Researching STNG
Want to do more research on Scorpio Tankers Inc's stock and its price? Try the links below:Scorpio Tankers Inc (STNG) Stock Price | Nasdaq
Scorpio Tankers Inc (STNG) Stock Quote, History and News - Yahoo Finance
Scorpio Tankers Inc (STNG) Stock Price and Basic Information | MarketWatch


Loading social stream, please wait...