Stanley Black & Decker Inc. (SWK): Price and Financial Metrics
SWK Price/Volume Stats
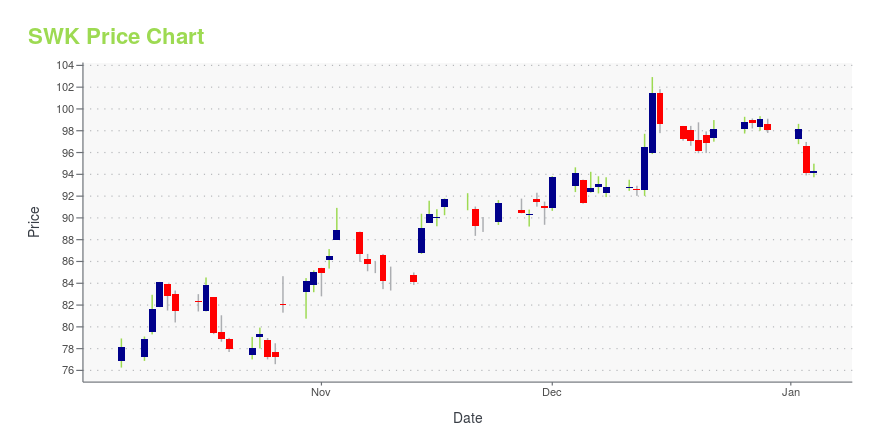
Current price | $84.40 | 52-week high | $104.21 |
Prev. close | $86.11 | 52-week low | $70.24 |
Day low | $84.30 | Volume | 1,200,955 |
Day high | $85.52 | Avg. volume | 1,643,389 |
50-day MA | $93.75 | Dividend yield | 3.71% |
200-day MA | $85.74 | Market Cap | 12.93B |
SWK Stock Price Chart Interactive Chart >
SWK POWR Grades
- SWK scores best on the Momentum dimension, with a Momentum rank ahead of 85.35% of US stocks.
- SWK's strongest trending metric is Value; it's been moving down over the last 179 days.
- SWK's current lowest rank is in the Growth metric (where it is better than 5.05% of US stocks).
SWK Stock Summary
- SWK's went public 37.74 years ago, making it older than 93.16% of listed US stocks we're tracking.
- Price to trailing twelve month operating cash flow for SWK is currently 65.51, higher than 95.31% of US stocks with positive operating cash flow.
- STANLEY BLACK & DECKER INC's shareholder yield -- a measure of how much capital is returned to stockholders via dividends and buybacks -- is 28.3%, greater than the shareholder yield of 93.35% of stocks in our set.
- Stocks with similar financial metrics, market capitalization, and price volatility to STANLEY BLACK & DECKER INC are CAG, AVY, BAH, FLS, and MAT.
- SWK's SEC filings can be seen here. And to visit STANLEY BLACK & DECKER INC's official web site, go to www.stanleyblackanddecker.com.
SWK Valuation Summary
- SWK's price/earnings ratio is 17.1; this is 8.06% lower than that of the median Industrials stock.
- Over the past 243 months, SWK's price/sales ratio has gone down 0.1.
Below are key valuation metrics over time for SWK.
Stock | Date | P/S | P/B | P/E | EV/EBIT |
---|---|---|---|---|---|
SWK | 2023-09-15 | 0.8 | 1.4 | 17.1 | 22.1 |
SWK | 2023-09-14 | 0.8 | 1.4 | 17.0 | 22.1 |
SWK | 2023-09-13 | 0.8 | 1.4 | 17.0 | 22.0 |
SWK | 2023-09-12 | 0.8 | 1.4 | 17.3 | 22.3 |
SWK | 2023-09-11 | 0.9 | 1.5 | 17.7 | 22.6 |
SWK | 2023-09-08 | 0.9 | 1.5 | 17.7 | 22.6 |
SWK Growth Metrics
- Its 5 year net cashflow from operations growth rate is now at 6.92%.
- Its 3 year cash and equivalents growth rate is now at -41.16%.
- The 5 year price growth rate now stands at -22.19%.

The table below shows SWK's growth in key financial areas (numbers in millions of US dollars).
Date | Revenue | Operating Cash Flow | Net Income to Common Stock |
---|---|---|---|
2022-12-31 | 16,947.4 | -1,459.5 | 1,062.5 |
2022-09-30 | 15,816.6 | -1,738.7 | 1,449.8 |
2022-06-30 | 15,960.2 | -1,308.5 | 1,019.4 |
2022-03-31 | 15,868.1 | -420.2 | 1,386.5 |
2021-12-31 | 15,617.2 | 663.1 | 1,689.2 |
2021-09-30 | 17,168.8 | 1,713.1 | 1,804.9 |
SWK's Quality Factors
The “Quality” component of the POWR Ratings focuses on 31 different factors of a companies fundamentals and operational strength. Here are some key insights as we drill into the specifics of these quality attributes.- SWK has a Quality Grade of C, ranking ahead of 55.42% of graded US stocks.
- SWK's asset turnover comes in at 0.71 -- ranking 41st of 60 Construction Materials stocks.
- EXP, CR, and UFPI are the stocks whose asset turnover ratios are most correlated with SWK.
The table below shows SWK's key quality metrics over time.
Period | Asset Turnover | Gross Margin | ROIC |
---|---|---|---|
2021-07-03 | 0.710 | 0.360 | 0.279 |
2021-04-03 | 0.668 | 0.353 | 0.227 |
2021-01-02 | 0.629 | 0.342 | 0.173 |
2020-09-26 | 0.618 | 0.330 | 0.144 |
2020-06-27 | 0.621 | 0.326 | 0.127 |
2020-03-28 | 0.660 | 0.332 | 0.169 |
SWK Price Target
For more insight on analysts targets of SWK, see our SWK price target page. And for a list of of all stocks sorted by upside potential based on analyst target price, see our Top Price Target page.
Average Price Target | $235.62 | Average Broker Recommendation | 1.57 (Moderate Buy) |
Stanley Black & Decker Inc. (SWK) Company Bio
Stanley Black & Decker, Inc., formerly known as The Stanley Works, is a Fortune 500 American manufacturer of industrial tools and household hardware and provider of security products. Headquartered in the greater Hartford city of New Britain, Connecticut,[4] Stanley Black & Decker is the result of the merger of Stanley Works and Black & Decker on March 12, 2010. (Source:Wikipedia)
Latest SWK News From Around the Web
Below are the latest news stories about STANLEY BLACK & DECKER INC that investors may wish to consider to help them evaluate SWK as an investment opportunity.
Stanley Black (SWK) Up 21.1% YTD: Will the Momentum Continue?Stanley Black's (SWK) efforts to eliminate and reduce overlapping capabilities and functions bode well for the company. Its shareholder-friendly measures are encouraging. |
The 3 Best Dividend Stocks to Buy Now: September 2023Looking to profit from dividend investing? |
3 Reasons Why You Should Invest in Dividend KingsThere are dividend stocks and then there are Dividend Kings. It's hard to argue with the kind of success they've achieved. |
3 Debt-Ridden S&P 500 Stocks to Sell Before It’s Too LateS&P 500 companies collectively saw second-quarter earnings fall by 4% over last year. |
Zacks Industry Outlook Highlights Stanley Black & Decker and Lincoln ElectricStanley Black & Decker and Lincoln Electric are part of the Zacks Industry Outlook article. |
SWK Price Returns
1-mo | -4.84% |
3-mo | -3.05% |
6-mo | 15.87% |
1-year | 5.08% |
3-year | -40.88% |
5-year | -38.47% |
YTD | 15.59% |
2022 | -58.92% |
2021 | 7.28% |
2020 | 9.73% |
2019 | 41.18% |
2018 | -28.13% |
SWK Dividends
Ex-Dividend Date | Type | Payout Amount | Change | ||||||
---|---|---|---|---|---|---|---|---|---|
Loading, please wait... |
Continue Researching SWK
Want to do more research on Stanley Black & Decker Inc's stock and its price? Try the links below:Stanley Black & Decker Inc (SWK) Stock Price | Nasdaq
Stanley Black & Decker Inc (SWK) Stock Quote, History and News - Yahoo Finance
Stanley Black & Decker Inc (SWK) Stock Price and Basic Information | MarketWatch
Loading social stream, please wait...