
Trinseo S.A. Ordinary Shares (TSE): Price and Financial Metrics
TSE Price/Volume Stats
| Current price | $2.85 | 52-week high | $18.09 |
| Prev. close | $2.71 | 52-week low | $1.93 |
| Day low | $2.65 | Volume | 240,418 |
| Day high | $2.87 | Avg. volume | 479,929 |
| 50-day MA | $2.85 | Dividend yield | 1.4% |
| 200-day MA | $4.74 | Market Cap | 100.59M |
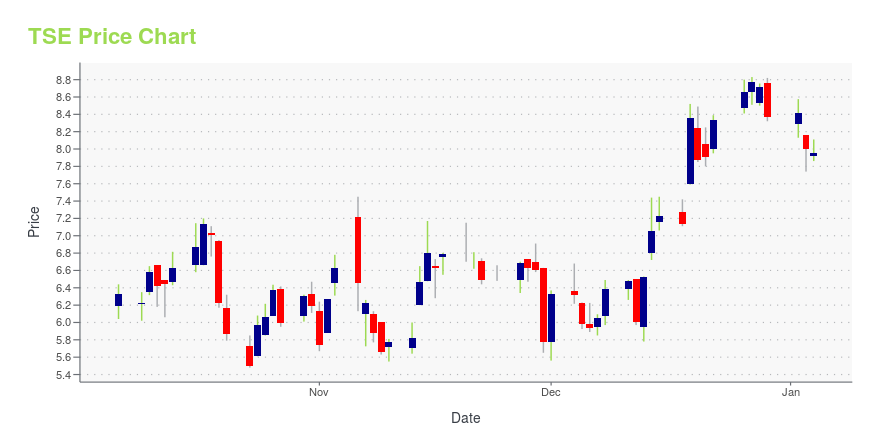
TSE Stock Price Chart Interactive Chart >
Trinseo S.A. Ordinary Shares (TSE) Company Bio
Trinseo is a leading global materials company and manufacturer of plastics, latex and rubber, used in industries such as home appliances, automotive, building & construction, carpet, consumer electronics, consumer goods, electrical & lighting, medical, packaging, paper & paperboard, rubber goods and tires. The company was founded in 2010 and is based in Berwyn, Pennsylvania.
Latest TSE News From Around the Web
Below are the latest news stories about TRINSEO PLC that investors may wish to consider to help them evaluate TSE as an investment opportunity.
New Trinseo PMMA Depolymerization Plant Reimagines Plastics Value Chain With Sustainability In MindWAYNE, Pa., December 06, 2023--Trinseo ("Trinseo" or "the Company") (NYSE: TSE), a specialty material solutions provider, is helping advance the potential of sustainable plastics with the inauguration of its next generation, polymethyl methacrylate (PMMA) depolymerization plant in Rho, Italy. Scheduled to be commissioned in Q1 2024, this demonstration facility marks a pivotal step towards reshaping the plastics ecosystem as part of the circular economy. PMMA, renowned for its versatility in vari |
Trinseo Announces Quarterly Dividend of $0.01 Per ShareWAYNE, Pa., November 16, 2023--Trinseo (NYSE: TSE), a specialty material solutions provider, today announced that its Board of Directors authorized a quarterly dividend of $0.01 per share. The dividend will be a cash distribution payable on January 18, 2024 to shareholders of record as of the close of business on January 4, 2024. |
Trinseo PLC (NYSE:TSE) Q3 2023 Earnings Call TranscriptTrinseo PLC (NYSE:TSE) Q3 2023 Earnings Call Transcript November 6, 2023 Operator: Good morning, ladies and gentlemen, and welcome to the Trinseo Third Quarter 2023 Financial Results Conference Call. We welcome the Trinseo management team, Frank Bozich, President and CEO; David Stasse, Executive Vice President and CFO; and Andy Myers, Director of Investor Relations. Today’s […] |
Q3 2023 Trinseo PLC Earnings CallQ3 2023 Trinseo PLC Earnings Call |
Trinseo PLC (TSE) Reports Q3 2023 Financial Results: Net Sales Decrease by 25% Year-Over-YearCompany's Net Loss from Continuing Operations Improves by $80 Million Compared to Prior Year |
TSE Price Returns
| 1-mo | 14.11% |
| 3-mo | 1.93% |
| 6-mo | -55.82% |
| 1-year | -83.05% |
| 3-year | -94.17% |
| 5-year | -91.76% |
| YTD | -65.65% |
| 2023 | -62.31% |
| 2022 | -55.07% |
| 2021 | 3.47% |
| 2020 | 46.65% |
| 2019 | -15.61% |
TSE Dividends
| Ex-Dividend Date | Type | Payout Amount | Change | ||||||
|---|---|---|---|---|---|---|---|---|---|
| Loading, please wait... | |||||||||
Continue Researching TSE
Want to see what other sources are saying about Trinseo SA's financials and stock price? Try the links below:Trinseo SA (TSE) Stock Price | Nasdaq
Trinseo SA (TSE) Stock Quote, History and News - Yahoo Finance
Trinseo SA (TSE) Stock Price and Basic Information | MarketWatch
Loading social stream, please wait...