Texas Instruments Inc. (TXN): Price and Financial Metrics


Texas Instruments Inc. (TXN): $177.49

0.44 (+0.25%)

POWR Rating

Component Grades

Growth

S

Value

I

Momentum

G

Stability

N

Sentiment

U

Quality

P

TXN POWR Grades

  • Quality is the dimension where TXN ranks best; there it ranks ahead of 92.46% of US stocks.
  • The strongest trend for TXN is in Growth, which has been heading down over the past 177 days.
  • TXN ranks lowest in Growth; there it ranks in the 7th percentile.

TXN Stock Summary

  • TEXAS INSTRUMENTS INC's market capitalization of $162,673,002,260 is ahead of 98.94% of US-listed equities.
  • TEXAS INSTRUMENTS INC's stock had its IPO on January 1, 1986, making it an older stock than 93.5% of US equities in our set.
  • In terms of volatility of its share price, TXN is more volatile than just 5.31% of stocks we're observing.
  • Stocks that are quantitatively similar to TXN, based on their financial statements, market capitalization, and price volatility, are NFLX, AMD, NVS, AMGN, and RTX.
  • Visit TXN's SEC page to see the company's official filings. To visit the company's web site, go to www.ti.com.

TXN Valuation Summary

  • In comparison to the median Technology stock, TXN's price/sales ratio is 237.5% higher, now standing at 8.1.
  • Over the past 243 months, TXN's price/sales ratio has gone up 4.4.

Below are key valuation metrics over time for TXN.

Stock Date P/S P/B P/E EV/EBIT
TXN 2023-03-21 8.1 11.1 18.5 16.3
TXN 2023-03-20 8.1 11.1 18.6 16.4
TXN 2023-03-17 8.0 10.9 18.2 16.1
TXN 2023-03-16 8.0 11.0 18.3 16.2
TXN 2023-03-15 7.9 10.8 18.1 16.0
TXN 2023-03-14 8.0 10.9 18.2 16.1

TXN Growth Metrics

    Its year over year revenue growth rate is now at 22.95%.
  • Its 4 year net cashflow from operations growth rate is now at 31.49%.
  • The year over year net cashflow from operations growth rate now stands at 26.79%.
TXN's revenue has moved up $5,910,000,000 over the prior 34 months.

The table below shows TXN's growth in key financial areas (numbers in millions of US dollars).

Date Revenue Operating Cash Flow Net Income to Common Stock
2022-12-31 20,028 8,720 8,749
2022-09-30 20,190 9,035 8,925
2022-06-30 19,592 8,697 8,577
2022-03-31 18,960 9,050 8,217
2021-12-31 18,344 8,756 7,769
2021-09-30 17,588 8,524 7,319

TXN's Quality Factors

The “Quality” component of the POWR Ratings focuses on 31 different factors of a companies fundamentals and operational strength. Here are some key insights as we drill into the specifics of these quality attributes.
  • TXN has a Quality Grade of A, ranking ahead of 96.51% of graded US stocks.
  • TXN's asset turnover comes in at 0.849 -- ranking 65th of 208 Electronic Equipment stocks.
  • SWKS, DZSI, and CTS are the stocks whose asset turnover ratios are most correlated with TXN.

The table below shows TXN's key quality metrics over time.

Period Asset Turnover Gross Margin ROIC
2021-09-30 0.849 0.664 0.503
2021-06-30 0.862 0.655 0.485
2021-03-31 0.826 0.647 0.450
2020-12-31 0.800 0.641 0.424
2020-09-30 0.774 0.635 0.388
2020-06-30 0.774 0.636 0.403

TXN Price Target

For more insight on analysts targets of TXN, see our TXN price target page. And for a list of of all stocks sorted by upside potential based on analyst target price, see our Top Price Target page.

Average Price Target $204.49 Average Broker Recommendation 1.76 (Moderate Buy)

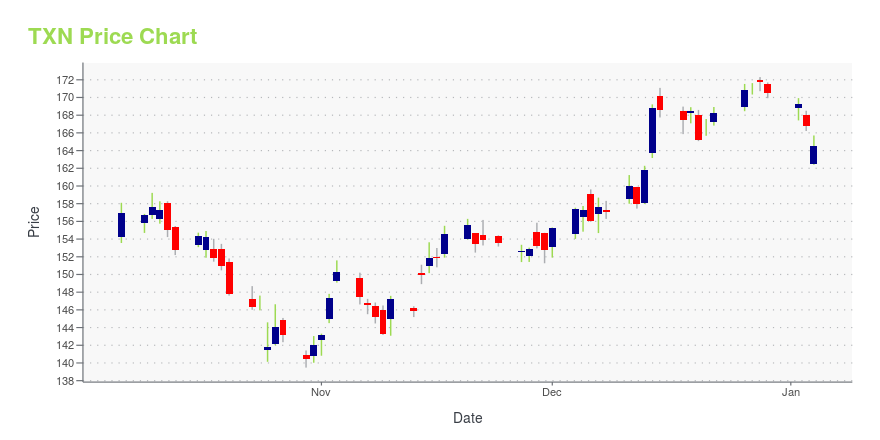
TXN Stock Price Chart Interactive Chart >

Price chart for TXN

TXN Price/Volume Stats

Current price $177.49 52-week high $191.34
Prev. close $177.05 52-week low $144.46
Day low $174.25 Volume 4,061,636
Day high $177.59 Avg. volume 5,358,620
50-day MA $175.68 Dividend yield 2.76%
200-day MA $168.70 Market Cap 160.84B

Texas Instruments Inc. (TXN) Company Bio


Texas Instruments Incorporated (TI) is an American technology company headquartered in DallasTexas, that designs and manufactures semiconductors and various integrated circuits, which it sells to electronics designers and manufacturers globally. It is one of the top 10 semiconductor companies worldwide based on sales volume. The company's focus is on developing analog chips and embedded processors, which account for more than 80% of its revenue. TI also produces TI digital light processing technology and education technology products including calculatorsmicrocontrollers and multi-core processors. The company holds 45,000 patents worldwide as of 2016. (Source:Wikipedia)


TXN Latest News Stream


Event/Time News Detail
Loading, please wait...

TXN Latest Social Stream


Loading social stream, please wait...

View Full TXN Social Stream

Latest TXN News From Around the Web

Below are the latest news stories about TEXAS INSTRUMENTS INC that investors may wish to consider to help them evaluate TXN as an investment opportunity.

With 86% ownership of the shares, Texas Instruments Incorporated (NASDAQ:TXN) is heavily dominated by institutional owners

Key Insights Significantly high institutional ownership implies Texas Instruments' stock price is sensitive to their...

Yahoo | March 27, 2023

Recessions Don't Have to Be Scary for Your Portfolio. Here's Why.

The economy is cyclical, and if you go in knowing that, you can create a balance and focus that will survive the swings.

Yahoo | March 24, 2023

Zacks Market Edge Highlights: NVIDIA, Broadcom, Texas Instruments, Advanced Micro Devices and Qualcomm

NVIDIA, Broadcom, Texas Instruments, Advanced Micro Devices and Qualcomm are part of the Zacks Market Edge blog.

Yahoo | March 23, 2023

Texas Instruments (TXN) Stock Moves -1.17%: What You Should Know

In the latest trading session, Texas Instruments (TXN) closed at $176.32, marking a -1.17% move from the previous day.

Yahoo | March 22, 2023

Should You Chase the Semiconductor Stocks in 2023?

The semiconductor stocks are outperforming the S&P 500 this year. Is it too late to get in?

Yahoo | March 22, 2023

Read More 'TXN' Stories Here

TXN Price Returns

1-mo 4.94%
3-mo 10.90%
6-mo 13.71%
1-year -1.66%
3-year 91.32%
5-year 95.54%
YTD 8.19%
2022 -9.86%
2021 17.53%
2020 31.70%
2019 39.56%
2018 -7.17%

TXN Dividends

Ex-Dividend Date Type Payout Amount Change
Loading, please wait...
View Full TXN Dividend History

Get Free Updates

Join thousands of investors who get the latest news, insights and top rated picks from StockNews.com!


Page generated in 0.7936 seconds.