Visa Inc. CI A (V): Price and Financial Metrics
GET POWR RATINGS... FREE!
V POWR Grades
- V scores best on the Quality dimension, with a Quality rank ahead of 96.87% of US stocks.
- The strongest trend for V is in Quality, which has been heading up over the past 177 days.
- V's current lowest rank is in the Value metric (where it is better than 10.94% of US stocks).
V Stock Summary
- VISA INC's market capitalization of $464,294,376,010 is ahead of 99.8% of US-listed equities.
- With a price/sales ratio of 15.84, VISA INC has a higher such ratio than 92.73% of stocks in our set.
- The volatility of VISA INC's share price is greater than that of just 6.18% US stocks with at least 200 days of trading history.
- If you're looking for stocks that are quantitatively similar to VISA INC, a group of peers worth examining would be UNH, XOM, JPM, MA, and JNJ.
- V's SEC filings can be seen here. And to visit VISA INC's official web site, go to usa.visa.com.
V Valuation Summary
- In comparison to the median Financial Services stock, V's price/sales ratio is 444.83% higher, now standing at 15.8.
- V's price/sales ratio has moved up 3.1 over the prior 181 months.
Below are key valuation metrics over time for V.
Stock | Date | P/S | P/B | P/E | EV/EBIT |
---|---|---|---|---|---|
V | 2023-01-23 | 15.8 | 13.0 | 31.0 | 25.1 |
V | 2023-01-20 | 15.8 | 13.0 | 31.0 | 25.1 |
V | 2023-01-19 | 15.5 | 12.8 | 30.4 | 24.7 |
V | 2023-01-18 | 15.5 | 12.7 | 30.3 | 24.6 |
V | 2023-01-17 | 15.7 | 12.9 | 30.8 | 25.0 |
V | 2023-01-13 | 15.7 | 13.0 | 30.8 | 25.0 |
V Growth Metrics
- The 2 year net cashflow from operations growth rate now stands at 26.14%.
- Its 5 year cash and equivalents growth rate is now at 47.59%.
- Its year over year revenue growth rate is now at 26.14%.

The table below shows V's growth in key financial areas (numbers in millions of US dollars).
Date | Revenue | Operating Cash Flow | Net Income to Common Stock |
---|---|---|---|
2022-09-30 | 29,310 | 18,849 | 14,957 |
2022-06-30 | 28,082 | 16,944 | 14,601 |
2022-03-31 | 26,937 | 16,106 | 13,765 |
2021-12-31 | 25,477 | 15,946 | 13,144 |
2021-09-30 | 24,105 | 15,227 | 12,311 |
2021-06-30 | 22,647 | 13,352 | 10,864 |
V's Quality Factors
The “Quality” component of the POWR Ratings focuses on 31 different factors of a companies fundamentals and operational strength. Here are some key insights as we drill into the specifics of these quality attributes.- V has a Quality Grade of B, ranking ahead of 90.16% of graded US stocks.
- V's asset turnover comes in at 0.279 -- ranking 449th of 563 Business Services stocks.
- FC, PGEN, and GOVX are the stocks whose asset turnover ratios are most correlated with V.
The table below shows V's key quality metrics over time.
Period | Asset Turnover | Gross Margin | ROIC |
---|---|---|---|
2021-06-30 | 0.279 | 0.818 | 0.549 |
2021-03-31 | 0.267 | 0.815 | 0.506 |
2020-12-31 | 0.275 | 0.824 | 0.544 |
2020-09-30 | 0.285 | 0.827 | 0.597 |
2020-06-30 | 0.307 | 0.837 | 0.659 |
2020-03-31 | 0.329 | 0.847 | 0.699 |
V Price Target
For more insight on analysts targets of V, see our V price target page. And for a list of of all stocks sorted by upside potential based on analyst target price, see our Top Price Target page.
Average Price Target | $278.05 | Average Broker Recommendation | 1.4 (Moderate Buy) |
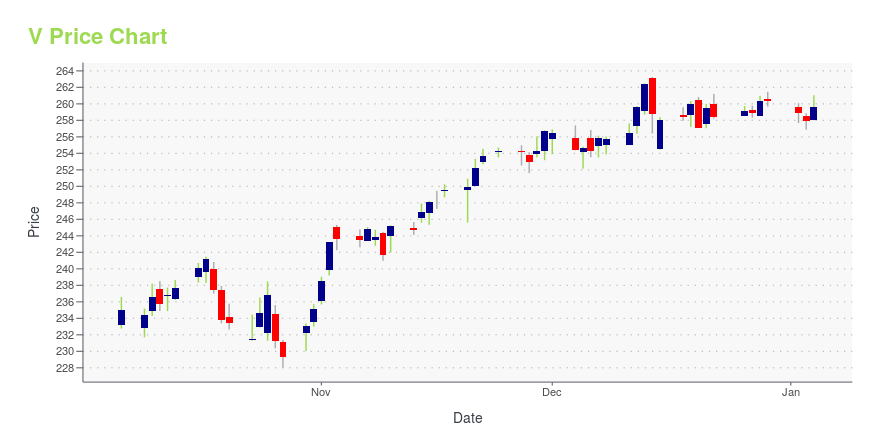
V Stock Price Chart Interactive Chart >
V Price/Volume Stats
Current price | $229.10 | 52-week high | $250.58 |
Prev. close | $231.44 | 52-week low | $174.60 |
Day low | $227.93 | Volume | 5,677,400 |
Day high | $230.42 | Avg. volume | 6,122,326 |
50-day MA | $214.16 | Dividend yield | 0.79% |
200-day MA | $204.93 | Market Cap | 431.51B |
Visa Inc. CI A (V) Company Bio
Visa Inc. stylized as VISA) is an American multinational financial services corporation headquartered in Foster City, California, United States. It facilitates electronic funds transfers throughout the world, most commonly through Visa-branded credit cards, debit cards and prepaid cards. Visa is one of the world's most valuable companies. (Source:Wikipedia)
Latest V News From Around the Web
Below are the latest news stories about VISA INC that investors may wish to consider to help them evaluate V as an investment opportunity.
US stock market closes higher, Dow Jones gains 0.08%At the close of the New York Stock Exchange, the Dow Jones rose 0.08%, the S&P 500 rose 0.25%, and the NASDAQ Composite rose 0.95%. The leading performer among the components of the Dow Jones index today was American Express Company, which gained 16.43 points or 10.54% to close at 172.31. Visa Inc Class A rose 6.73 points or 3.00% to close at 231.44. Walgreens Boots Alliance Inc rose 0.67 points or 1.84% to close at 37.17. The least gainers were shares of Intel Corporation, which lost 1.93 points or 6.41% to end the session at 28.16. Chevron Corp was up 4.44% or 8.34 points to close at 179.45 while The Travelers Companies Inc was down 1.74% or 3.35 points to close at 188. .76. Leading gainers among the S&P 500 index components in today''s trading were Tesla Inc, which rose 10.99% to 177... |
Which Is Better - Visa Or Mastercard (NYSE:V)Visa and Mastercard share a lot of similarities. See why Both V and MA are excellent investments for investors who hope to have exposure to FinTech. |
Embrace the Stock Breakout for Colossal Gains in 2023The prevailing economic conditions will continue to improve as we push deeper into 2023. |
Charming stocks: Marqeta, Inc. (NASDAQ:MQ -3.98%), Visa Inc. (NYSE:V 2.99%)There are two main reasons why moving averages are useful in forex trading: moving averages help traders define trend recognize changes in trend. Now well have a look on, SMA50 … The post Charming stocks: Marqeta, Inc. (NASDAQ:MQ -3.98%), Visa Inc. (NYSE:V 2.99%) appeared first on Stocks Equity . |
Visa Inc (V) Q1 2023 Earnings Call Transcript | AlphaStreetVisa Inc (NYSE:V) Q1 2023 Earnings Call dated Jan. 26, 2023. |
V Price Returns
1-mo | 10.27% |
3-mo | 14.53% |
6-mo | 8.00% |
1-year | 2.30% |
3-year | 17.72% |
5-year | 88.75% |
YTD | 10.27% |
2022 | -3.18% |
2021 | -0.31% |
2020 | 17.12% |
2019 | 43.33% |
2018 | 16.49% |
V Dividends
Ex-Dividend Date | Type | Payout Amount | Change | ||||||
---|---|---|---|---|---|---|---|---|---|
Loading, please wait... |
Continue Researching V
Want to do more research on Visa Inc's stock and its price? Try the links below:Visa Inc (V) Stock Price | Nasdaq
Visa Inc (V) Stock Quote, History and News - Yahoo Finance
Visa Inc (V) Stock Price and Basic Information | MarketWatch
Loading social stream, please wait...