
Vistra Energy Corp. (VST): Price and Financial Metrics
VST Price/Volume Stats
| Current price | $71.12 | 52-week high | $107.24 |
| Prev. close | $70.38 | 52-week low | $27.54 |
| Day low | $70.12 | Volume | 4,229,800 |
| Day high | $72.30 | Avg. volume | 6,718,818 |
| 50-day MA | $88.85 | Dividend yield | 1.09% |
| 200-day MA | $59.40 | Market Cap | 24.71B |
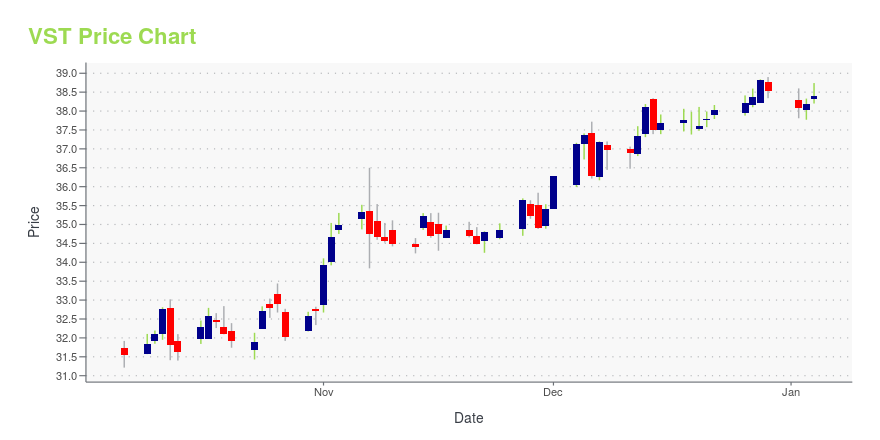
VST Stock Price Chart Interactive Chart >
Vistra Energy Corp. (VST) Company Bio
Vistra Energy Corp., an energy company, operates as an integrated power business in Texas. The company operates through two segments, Wholesale Generation and Retail Electricity. The company was formerly known as TCEH Corp. and changed its name to Vistra Energy Corp. in November 2016. The company is based in Dallas.
Latest VST News From Around the Web
Below are the latest news stories about VISTRA CORP that investors may wish to consider to help them evaluate VST as an investment opportunity.
Vistra Announces Pricing Terms of Cash Tender Offer for Senior Secured NotesVistra Corp. (NYSE: VST) ("Vistra") announced today the pricing terms of its previously announced cash tender offers (the "Tender Offers") to purchase a portion of Vistra's outstanding 3.550% Senior Secured Notes due 2024 ("3.550% 2024 Notes"), 4.875% Senior Secured Notes due 2024 ("4.875% 2024 Notes") and 5.125% Senior Secured Notes due 2025 ("5.125% 2025 Notes" and, together with the 3.550% 2024 Notes and 4.875% 2024 Notes, the "Notes") up to an aggregate principal amount that will not result |
Vistra Announces Early Results of Cash Tender Offer for Senior Secured NotesVistra Corp. (NYSE: VST) ("Vistra") announced today the results to date of its previously announced cash tender offers (the "Tender Offers") to purchase a portion of Vistra's outstanding 3.550% Senior Secured Notes due 2024 ("3.550% 2024 Notes"), 4.875% Senior Secured Notes due 2024 ("4.875% 2024 Notes") and 5.125% Senior Secured Notes due 2025 ("5.125% 2025 Notes" and, together with the 3.550% 2024 Notes and 4.875% 2024 Notes, the "Notes") up to an aggregate principal amount that will not resul |
Should You Hold Vistra Corp. (VST) for the Long-Term?Meridian Funds, managed by ArrowMark Partners, released its “Meridian Hedged Equity Fund” third quarter 2023 investor letter. A copy of the same can be downloaded here. In the quarter, the fund declined -1.36% (net), outperforming its benchmark, the S&P 500 Index, which declined -3.27%. The firm focuses on high-quality companies for long-term growth. In addition, […] |
Vistra's (NYSE:VST) investors will be pleased with their strong 122% return over the last three yearsThe worst result, after buying shares in a company (assuming no leverage), would be if you lose all the money you put... |
Reasons to Add Vistra (VST) to Your Portfolio Right NowVistra (VST) is making investments to strengthen its existing operations, increase shareholder value through buybacks and dividends, and continue to serve its customers efficiently. |
VST Price Returns
| 1-mo | -17.22% |
| 3-mo | -1.92% |
| 6-mo | 75.46% |
| 1-year | 157.66% |
| 3-year | 299.96% |
| 5-year | 274.91% |
| YTD | 85.75% |
| 2023 | 70.74% |
| 2022 | 5.07% |
| 2021 | 19.57% |
| 2020 | -11.87% |
| 2019 | 2.46% |
VST Dividends
| Ex-Dividend Date | Type | Payout Amount | Change | ||||||
|---|---|---|---|---|---|---|---|---|---|
| Loading, please wait... | |||||||||
Continue Researching VST
Want to see what other sources are saying about Vistra Energy Corp's financials and stock price? Try the links below:Vistra Energy Corp (VST) Stock Price | Nasdaq
Vistra Energy Corp (VST) Stock Quote, History and News - Yahoo Finance
Vistra Energy Corp (VST) Stock Price and Basic Information | MarketWatch
Loading social stream, please wait...