
Wendy's Co. (WEN): Price and Financial Metrics
WEN Price/Volume Stats
| Current price | $16.79 | 52-week high | $22.42 |
| Prev. close | $16.98 | 52-week low | $15.61 |
| Day low | $16.75 | Volume | 4,186,264 |
| Day high | $17.07 | Avg. volume | 3,494,648 |
| 50-day MA | $17.04 | Dividend yield | 5.97% |
| 200-day MA | $18.54 | Market Cap | 3.44B |
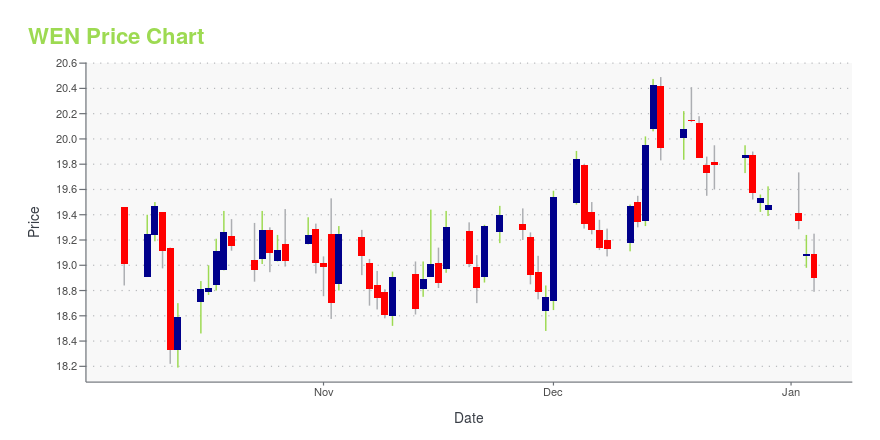
WEN Stock Price Chart Interactive Chart >
Wendy's Co. (WEN) Company Bio
Wendy's owns and franchises hamburger-focused Wendys restaurants. The company was founded in 1969 and is based in Dublin, Ohio.
Latest WEN News From Around the Web
Below are the latest news stories about WENDY'S CO that investors may wish to consider to help them evaluate WEN as an investment opportunity.
Wendy's (WEN) Banks on Digitization Efforts, Hurt by High CostsWendy's (WEN) focuses on new franchise additions to drive growth. However, high commodity and labor costs are a concern. |
Burger King finishes 'Year of the Whopper' with Wendy's challengeIt's not that McDonald's, Burger King, and Wendy's don't do some business over the holiday (not everyone can make an edible turkey) but it's generally a quiet time for all three companies. In general, Wendy's, McDonald's , and Burger King don't bring out many (or any in many cases) special offers in December. Wendy's does have a Peppermint Frosty, and McDonald's surprisingly brought out a Squishmallow Happy Meal, but both of these are promotions that will spread via social media without requiring much advertising. |
3 Growth at a Reasonable Price (GARP) Stocks for Balanced GrowthGARP stocks are less likely to plunge than growth stocks with high valuations and more likely to generate strong growth than value stocks. |
Eli Lilly cut to Outperform at Daiwa Securities: 4 big analyst cutsHere is your Pro Recap of the biggest analyst cuts you may have missed since yesterday: downgrades at Eli Lilly, Simon Property Group, Wendy's, and Chipotle Mexican Grill. Daiwa Securities downgraded Eli Lilly (NYSE:LLY) to Outperform from Buy with a price target of $610.00, as reported in real-time on InvestingPro. This price target implies a nearly 7% upside from the closing price on Wednesday. Earlier this week, Eli Lilly announced the extension of its tender offer for acquiring all outstanding shares of POINT Biopharma Global (NASDAQ:PNT) at $12.50 per share in cash. |
Burger King's menu adds a cheesy new Whopper mealThe fast-food giant is leaning on its advantages over McDonald's and trying to fix a key problem. |
WEN Price Returns
| 1-mo | -0.06% |
| 3-mo | -15.42% |
| 6-mo | -9.97% |
| 1-year | -17.97% |
| 3-year | -19.82% |
| 5-year | 2.38% |
| YTD | -11.35% |
| 2023 | -9.65% |
| 2022 | -2.77% |
| 2021 | 10.98% |
| 2020 | 0.07% |
| 2019 | 45.34% |
WEN Dividends
| Ex-Dividend Date | Type | Payout Amount | Change | ||||||
|---|---|---|---|---|---|---|---|---|---|
| Loading, please wait... | |||||||||
Continue Researching WEN
Want to do more research on Wendy's Co's stock and its price? Try the links below:Wendy's Co (WEN) Stock Price | Nasdaq
Wendy's Co (WEN) Stock Quote, History and News - Yahoo Finance
Wendy's Co (WEN) Stock Price and Basic Information | MarketWatch
Loading social stream, please wait...