
Wabash National Corporation (WNC): Price and Financial Metrics
WNC Price/Volume Stats
| Current price | $21.08 | 52-week high | $30.07 |
| Prev. close | $20.51 | 52-week low | $20.00 |
| Day low | $20.48 | Volume | 850,754 |
| Day high | $21.17 | Avg. volume | 613,580 |
| 50-day MA | $21.67 | Dividend yield | 1.42% |
| 200-day MA | $24.00 | Market Cap | 949.08M |
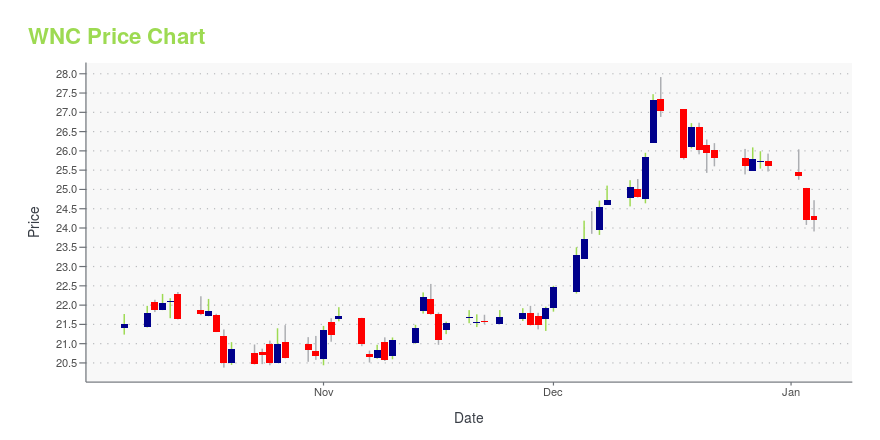
WNC Stock Price Chart Interactive Chart >
Wabash National Corporation (WNC) Company Bio
Wabash National Corporation specializes in the design and production of dry freight vans, refrigerated vans, platform trailers, bulk tank trailers, intermodal equipment, engineered products, and composite products. The company was founded in 1985 and is based in Lafayette, Indiana.
Latest WNC News From Around the Web
Below are the latest news stories about WABASH NATIONAL CORP that investors may wish to consider to help them evaluate WNC as an investment opportunity.
Wabash Honored as One of America’s Most Responsible Companies by NewsweekAmerica's Most Responsible Companies 2024 by Newsweek Wabash is recognized by Newsweek as one of America's Most Responsible Companies for 2024. LAFAYETTE, Ind., Dec. 21, 2023 (GLOBE NEWSWIRE) -- Wabash (NYSE: WNC), the innovation leader of connected solutions for the transportation, logistics and distribution industries, was recently recognized among Newsweek’s America’s Most Responsible Companies 2024. Newsweek partnered with global research and data firm Statista to recognize the top 600 most |
Here's Why We Think Wabash National (NYSE:WNC) Might Deserve Your Attention TodayFor beginners, it can seem like a good idea (and an exciting prospect) to buy a company that tells a good story to... |
Wabash National (WNC) Registers a Bigger Fall Than the Market: Important Facts to NoteWabash National (WNC) closed the most recent trading day at $27.04, moving -1.02% from the previous trading session. |
Forbes Names Wabash to List of America’s Most Successful Small-Cap Companies 2024LAFAYETTE, Ind., Dec. 12, 2023 (GLOBE NEWSWIRE) -- Wabash (NYSE: WNC), the visionary leader of connected solutions for the transportation, logistics and distribution industries, today announced it was named to the Forbes list of “America’s Most Successful Small-Cap Companies 2024.” The company ranked 29 out of nearly 1,000 companies evaluated. “We are honored to be recognized as one of the top small-cap companies in the country. This achievement is a testament not only to the hard work of our Wa |
Wabash National (WNC) Outpaces Stock Market Gains: What You Should KnowWabash National (WNC) reachead $24.73 at the closing of the latest trading day, reflecting a +0.73% change compared to its last close. |
WNC Price Returns
| 1-mo | 0.04% |
| 3-mo | -14.03% |
| 6-mo | -17.50% |
| 1-year | -4.10% |
| 3-year | 54.72% |
| 5-year | 47.02% |
| YTD | -16.92% |
| 2023 | 14.94% |
| 2022 | 18.17% |
| 2021 | 15.53% |
| 2020 | 20.30% |
| 2019 | 15.52% |
WNC Dividends
| Ex-Dividend Date | Type | Payout Amount | Change | ||||||
|---|---|---|---|---|---|---|---|---|---|
| Loading, please wait... | |||||||||
Continue Researching WNC
Want to see what other sources are saying about WABASH NATIONAL Corp's financials and stock price? Try the links below:WABASH NATIONAL Corp (WNC) Stock Price | Nasdaq
WABASH NATIONAL Corp (WNC) Stock Quote, History and News - Yahoo Finance
WABASH NATIONAL Corp (WNC) Stock Price and Basic Information | MarketWatch
Loading social stream, please wait...