Western New England Bancorp, Inc. (WNEB): Price and Financial Metrics
GET POWR RATINGS... FREE!
WNEB POWR Grades
- Stability is the dimension where WNEB ranks best; there it ranks ahead of 97.62% of US stocks.
- WNEB's strongest trending metric is Stability; it's been moving up over the last 179 days.
- WNEB's current lowest rank is in the Quality metric (where it is better than 21.53% of US stocks).
WNEB Stock Summary
- WNEB's one year PEG ratio, measuring expected growth in earnings next year relative to current common stock price is 491.86 -- higher than 94.92% of US-listed equities with positive expected earnings growth.
- Equity multiplier, or assets relative to shareholders' equity, comes in at 11.78 for WESTERN NEW ENGLAND BANCORP INC; that's greater than it is for 94.17% of US stocks.
- With a year-over-year growth in debt of 80.54%, WESTERN NEW ENGLAND BANCORP INC's debt growth rate surpasses 86.29% of about US stocks.
- Stocks with similar financial metrics, market capitalization, and price volatility to WESTERN NEW ENGLAND BANCORP INC are BMRC, CASS, SAL, TCFC, and FVCB.
- Visit WNEB's SEC page to see the company's official filings. To visit the company's web site, go to www.westfieldbank.com.
WNEB Valuation Summary
- In comparison to the median Financial Services stock, WNEB's price/sales ratio is 100% higher, now standing at 2.4.
- WNEB's price/sales ratio has moved down 4.1 over the prior 243 months.
Below are key valuation metrics over time for WNEB.
Stock | Date | P/S | P/B | P/E | EV/EBIT |
---|---|---|---|---|---|
WNEB | 2023-01-23 | 2.4 | 1 | 9.1 | 7.4 |
WNEB | 2023-01-20 | 2.4 | 1 | 9.1 | 7.4 |
WNEB | 2023-01-19 | 2.4 | 1 | 9.1 | 7.4 |
WNEB | 2023-01-18 | 2.4 | 1 | 9.1 | 7.4 |
WNEB | 2023-01-17 | 2.4 | 1 | 9.2 | 7.5 |
WNEB | 2023-01-13 | 2.5 | 1 | 9.4 | 7.6 |
WNEB Growth Metrics
- The 3 year net income to common stockholders growth rate now stands at 42.34%.
- The 2 year cash and equivalents growth rate now stands at 135.79%.
- The 4 year revenue growth rate now stands at 29.45%.

The table below shows WNEB's growth in key financial areas (numbers in millions of US dollars).
Date | Revenue | Operating Cash Flow | Net Income to Common Stock |
---|---|---|---|
2022-09-30 | 87.645 | 28.33 | 23.073 |
2022-06-30 | 87.602 | 22.348 | 23.11 |
2022-03-31 | 87.182 | 23.605 | 23.227 |
2021-12-31 | 86.666 | 27.542 | 23.699 |
2021-09-30 | 85.285 | 26.391 | 22.492 |
2021-06-30 | 78.567 | 26.527 | 18.557 |
WNEB's Quality Factors
The “Quality” component of the POWR Ratings focuses on 31 different factors of a companies fundamentals and operational strength. Here are some key insights as we drill into the specifics of these quality attributes.- WNEB has a Quality Grade of C, ranking ahead of 38.73% of graded US stocks.
- WNEB's asset turnover comes in at 0.032 -- ranking 339th of 430 Banking stocks.
- GWB, CIT, and CPF are the stocks whose asset turnover ratios are most correlated with WNEB.
The table below shows WNEB's key quality metrics over time.
Period | Asset Turnover | Gross Margin | ROIC |
---|---|---|---|
2021-06-30 | 0.032 | 1 | 0.010 |
2021-03-31 | 0.029 | 1 | 0.008 |
2020-12-31 | 0.028 | 1 | 0.006 |
2020-09-30 | 0.026 | 1 | 0.005 |
2020-06-30 | 0.028 | 1 | 0.006 |
2020-03-31 | 0.029 | 1 | 0.007 |
WNEB Price Target
For more insight on analysts targets of WNEB, see our WNEB price target page. And for a list of of all stocks sorted by upside potential based on analyst target price, see our Top Price Target page.
Average Price Target | $9.88 | Average Broker Recommendation | 1.25 (Strong Buy) |
WNEB Stock Price Chart Interactive Chart >
WNEB Price/Volume Stats
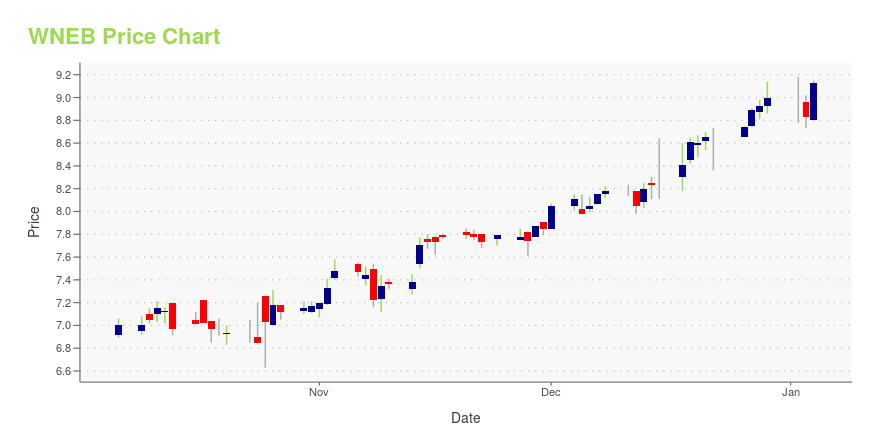
Current price | $9.70 | 52-week high | $10.25 |
Prev. close | $9.61 | 52-week low | $7.13 |
Day low | $9.64 | Volume | 37,883 |
Day high | $9.71 | Avg. volume | 43,659 |
50-day MA | $9.56 | Dividend yield | 2.5% |
200-day MA | $8.65 | Market Cap | 215.11M |
Western New England Bancorp, Inc. (WNEB) Company Bio
Western New England Bancorp, Inc. operates as the holding company for the Westfield Bank that provides community banking products and services to individuals and businesses in Massachusetts and Connecticut. The company was formerly known as Westfield Financial, Inc. and changed its name to Western New England Bancorp, Inc. in October 2016. The company was founded in 1853 and is based in Westfield, Massachusetts.
Latest WNEB News From Around the Web
Below are the latest news stories about WESTERN NEW ENGLAND BANCORP INC that investors may wish to consider to help them evaluate WNEB as an investment opportunity.
Strength Seen in Western New England Bancorp (WNEB): Can Its 6.3% Jump Turn into More Strength?Western New England Bancorp (WNEB) was a big mover last session on higher-than-average trading volume. The latest trend in earnings estimate revisions might not help the stock continue moving higher in the near term. |
Western New England Bancorp (WNEB) is on the Move, Here's Why the Trend Could be SustainableWestern New England Bancorp (WNEB) could be a great choice for investors looking to make a profit from fundamentally strong stocks that are currently on the move. It is one of the several stocks that made it through our "Recent Price Strength" screen. |
Western New England Bancorp (WNEB)'s Technical Outlook is Bright After Key Golden CrossIs it a good or bad thing when a stock experiences a golden cross technical event? |
Western New England Bancorp Third Quarter 2022 Earnings: Beats ExpectationsWestern New England Bancorp ( NASDAQ:WNEB ) Third Quarter 2022 Results Key Financial Results Revenue: US$22.2m (flat on... |
Western New England Bancorp (NASDAQ:WNEB) Will Pay A Dividend Of $0.06Western New England Bancorp, Inc. ( NASDAQ:WNEB ) will pay a dividend of $0.06 on the 23rd of November. The dividend... |
WNEB Price Returns
1-mo | 2.00% |
3-mo | 10.97% |
6-mo | 11.72% |
1-year | 10.26% |
3-year | 15.71% |
5-year | -0.03% |
YTD | 2.54% |
2022 | 10.97% |
2021 | 30.21% |
2020 | -26.04% |
2019 | -2.03% |
2018 | -6.45% |
WNEB Dividends
Ex-Dividend Date | Type | Payout Amount | Change | ||||||
---|---|---|---|---|---|---|---|---|---|
Loading, please wait... |
Continue Researching WNEB
Want to see what other sources are saying about Western New England Bancorp Inc's financials and stock price? Try the links below:Western New England Bancorp Inc (WNEB) Stock Price | Nasdaq
Western New England Bancorp Inc (WNEB) Stock Quote, History and News - Yahoo Finance
Western New England Bancorp Inc (WNEB) Stock Price and Basic Information | MarketWatch
Loading social stream, please wait...