
Waterstone Financial, Inc. (WSBF): Price and Financial Metrics
WSBF Price/Volume Stats
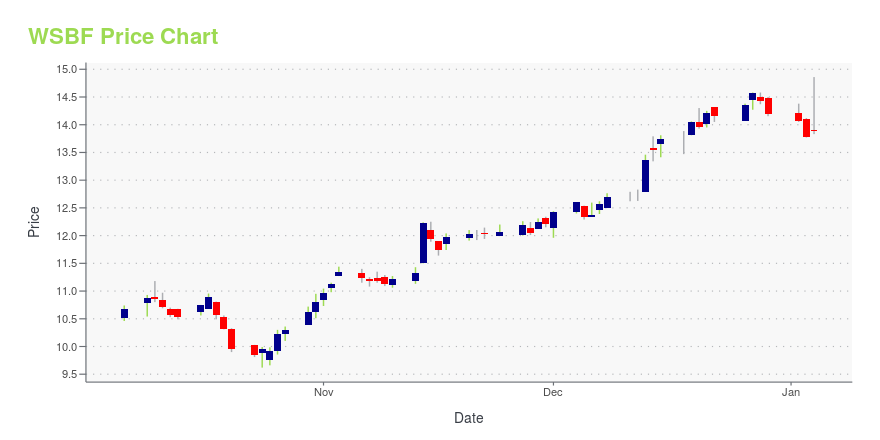
| Current price | $11.79 | 52-week high | $15.56 |
| Prev. close | $11.74 | 52-week low | $9.62 |
| Day low | $11.60 | Volume | 79,138 |
| Day high | $11.88 | Avg. volume | 57,152 |
| 50-day MA | $11.77 | Dividend yield | 5.19% |
| 200-day MA | $12.36 | Market Cap | 234.82M |
WSBF Stock Price Chart Interactive Chart >
Waterstone Financial, Inc. (WSBF) Company Bio
Waterstone Financial, Inc. operates as a bank holding company for WaterStone Bank SSB that provides various financial services to customers in southeastern Wisconsin. The company is based in Wauwatosa, Wisconsin.
Latest WSBF News From Around the Web
Below are the latest news stories about WATERSTONE FINANCIAL INC that investors may wish to consider to help them evaluate WSBF as an investment opportunity.
Waterstone Financial Declares Regular Quarterly Cash DividendWAUWATOSA, Wis., Dec. 21, 2023 (GLOBE NEWSWIRE) -- On December 21, 2023, the Board of Directors of Waterstone Financial, Inc. (NASDAQ: WSBF) declared a regular quarterly cash dividend of $0.15 per common share. The dividend is payable on February 1, 2024, to shareholders of record at the close of business on January 8, 2024. About Waterstone Financial, Inc: Waterstone Financial, Inc. is the savings and loan holding company for WaterStone Bank. WaterStone Bank was established in 1921 and offers a |
With 55% ownership, Waterstone Financial, Inc. (NASDAQ:WSBF) boasts of strong institutional backingKey Insights Institutions' substantial holdings in Waterstone Financial implies that they have significant influence... |
Waterstone Financial Inc (WSBF) Reports Q3 2023 Earnings, Navigates Rising Interest Rates and ...WSBF's net income drops to $3.3 million in Q3 2023 from $5.3 million in Q3 2022 |
Waterstone Financial, Inc. Announces Results of Operations for the Quarter and Nine Months Ended September 30, 2023WAUWATOSA, Wis., Oct. 24, 2023 (GLOBE NEWSWIRE) -- Waterstone Financial, Inc. (NASDAQ: WSBF), holding company for WaterStone Bank, reported net income of $3.3 million, or $0.16 per diluted share for the quarter ended September 30, 2023, compared to $5.3 million, or $0.25 per diluted share for the quarter ended September 30, 2022. Net income per diluted share was $0.46 for the nine months ended September 30, 2023, compared to net income per diluted share of $0.83 for the nine months ended Septemb |
Shareholders in Waterstone Financial (NASDAQ:WSBF) are in the red if they invested a year agoPassive investing in an index fund is a good way to ensure your own returns roughly match the overall market. While... |
WSBF Price Returns
| 1-mo | 1.14% |
| 3-mo | -14.92% |
| 6-mo | 17.35% |
| 1-year | -12.03% |
| 3-year | -27.74% |
| 5-year | -3.98% |
| YTD | -14.96% |
| 2023 | -13.10% |
| 2022 | -15.76% |
| 2021 | 23.92% |
| 2020 | 7.24% |
| 2019 | 20.39% |
WSBF Dividends
| Ex-Dividend Date | Type | Payout Amount | Change | ||||||
|---|---|---|---|---|---|---|---|---|---|
| Loading, please wait... | |||||||||
Continue Researching WSBF
Want to see what other sources are saying about Waterstone Financial Inc's financials and stock price? Try the links below:Waterstone Financial Inc (WSBF) Stock Price | Nasdaq
Waterstone Financial Inc (WSBF) Stock Quote, History and News - Yahoo Finance
Waterstone Financial Inc (WSBF) Stock Price and Basic Information | MarketWatch
Loading social stream, please wait...