Williams-Sonoma Inc. (WSM): Price and Financial Metrics
WSM Price/Volume Stats
Current price | $157.18 | 52-week high | $157.57 |
Prev. close | $153.67 | 52-week low | $109.22 |
Day low | $154.06 | Volume | 1,068,100 |
Day high | $157.57 | Avg. volume | 1,086,385 |
50-day MA | $139.44 | Dividend yield | 2.57% |
200-day MA | $126.23 | Market Cap | 10.08B |
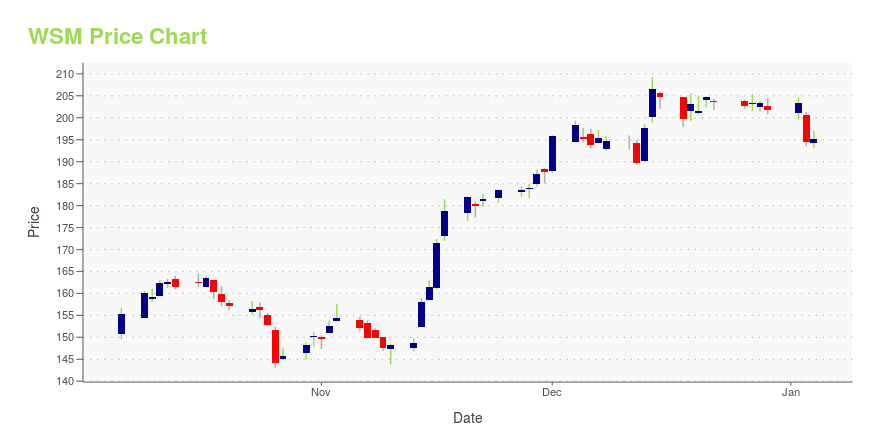
WSM Stock Price Chart Interactive Chart >
WSM POWR Grades
- Quality is the dimension where WSM ranks best; there it ranks ahead of 98.59% of US stocks.
- WSM's strongest trending metric is Sentiment; it's been moving up over the last 177 days.
- WSM's current lowest rank is in the Growth metric (where it is better than 20.03% of US stocks).
WSM Stock Summary
- The capital turnover (annual revenue relative to shareholder's equity) for WSM is 5.1 -- better than 90.98% of US stocks.
- WILLIAMS SONOMA INC's stock had its IPO on March 26, 1990, making it an older stock than 85.48% of US equities in our set.
- Of note is the ratio of WILLIAMS SONOMA INC's sales and general administrative expense to its total operating expenses; 87.23% of US stocks have a lower such ratio.
- Stocks that are quantitatively similar to WSM, based on their financial statements, market capitalization, and price volatility, are UFPI, MTH, SHOO, BKE, and MAT.
- Visit WSM's SEC page to see the company's official filings. To visit the company's web site, go to www.williams-sonomainc.com.
WSM Valuation Summary
- In comparison to the median Consumer Cyclical stock, WSM's price/sales ratio is 42.11% lower, now standing at 1.1.
- WSM's price/earnings ratio has moved down 18.7 over the prior 243 months.
Below are key valuation metrics over time for WSM.
Stock | Date | P/S | P/B | P/E | EV/EBIT |
---|---|---|---|---|---|
WSM | 2023-09-13 | 1.1 | 5.6 | 9.5 | 7.8 |
WSM | 2023-09-12 | 1.1 | 5.5 | 9.2 | 7.7 |
WSM | 2023-09-11 | 1.1 | 5.7 | 9.5 | 7.9 |
WSM | 2023-09-08 | 1.1 | 5.7 | 9.6 | 7.9 |
WSM | 2023-09-07 | 1.1 | 5.7 | 9.6 | 7.9 |
WSM | 2023-09-06 | 1.1 | 5.6 | 9.4 | 7.7 |
WSM Growth Metrics
- Its year over year net income to common stockholders growth rate is now at 32.02%.
- Its 4 year net cashflow from operations growth rate is now at 37.8%.
- Its 2 year price growth rate is now at 52.24%.

The table below shows WSM's growth in key financial areas (numbers in millions of US dollars).
Date | Revenue | Operating Cash Flow | Net Income to Common Stock |
---|---|---|---|
2022-09-30 | 8,722.367 | 1,171.333 | 1,175.852 |
2022-06-30 | 8,577.332 | 1,279.071 | 1,173.653 |
2022-03-31 | 8,388.134 | 1,316.785 | 1,152.648 |
2021-12-31 | 8,245.936 | 1,371.147 | 1,126.337 |
2021-09-30 | 8,037.58 | 1,336.559 | 1,032.351 |
2021-06-30 | 7,754.577 | 1,534.116 | 984.599 |
WSM's Quality Factors
The “Quality” component of the POWR Ratings focuses on 31 different factors of a companies fundamentals and operational strength. Here are some key insights as we drill into the specifics of these quality attributes.- WSM has a Quality Grade of A, ranking ahead of 99.83% of graded US stocks.
- WSM's asset turnover comes in at 1.79 -- ranking 61st of 165 Retail stocks.
- BKE, CTRN, and ORLY are the stocks whose asset turnover ratios are most correlated with WSM.
The table below shows WSM's key quality metrics over time.
Period | Asset Turnover | Gross Margin | ROIC |
---|---|---|---|
2021-08-01 | 1.790 | 0.423 | 0.398 |
2021-05-02 | 1.661 | 0.408 | 0.336 |
2021-01-31 | 1.518 | 0.389 | 0.253 |
2020-11-01 | 1.467 | 0.373 | 0.192 |
2020-08-02 | 1.421 | 0.362 | 0.139 |
2020-05-03 | 1.445 | 0.358 | 0.111 |
WSM Price Target
For more insight on analysts targets of WSM, see our WSM price target page. And for a list of of all stocks sorted by upside potential based on analyst target price, see our Top Price Target page.
Average Price Target | $190.59 | Average Broker Recommendation | 1.94 (Hold) |
Williams-Sonoma Inc. (WSM) Company Bio
Williams-Sonoma is a specialty retailer of products for the home with some brands in home furnishings. The Company operates in two segments: ecommerce and retail. The company was founded in 1956 and is based in San Francisco, California.
Latest WSM News From Around the Web
Below are the latest news stories about WILLIAMS SONOMA INC that investors may wish to consider to help them evaluate WSM as an investment opportunity.
These 2 Stocks Helped the Market Bounce Back MondayInvestors came into the new week feeling somewhat nervous about the state of the stock market, particularly given the losses earlier in September. The Nasdaq Composite (NASDAQINDEX: ^IXIC) picked up the most ground, but the Dow Jones Industrial Average (DJINDICES: ^DJI) and S&P 500 (SNPINDEX: ^GSPC) were also higher on the day. Among the more influential were Sea Limited (NYSE: SE) and Williams-Sonoma (NYSE: WSM), both of which were able to climb by more than 10%. |
Williams-Sonoma stock rises, Leonard Green increases stake in companyShares of Williams-Sonoma (WSM) jumped after news broke of private equity firm, Leonard Green & Partners, increasing its stake in the retail company. Yahoo Finance's Julie Hyman and Jared Blikre break down the recent news and how the stock is performing. For more expert insight and the latest market action, click here to watch this full episode of Yahoo Finance Live. |
Stock Market Today: Mega-Cap Strength Keeps Stocks Above WaterThe main benchmarks eked out increases Monday as several mega-cap stocks gained ground. Stocks struggled for direction Monday. Market participants are cautious looking ahead to a busy batch of economic data. Most notable in this week's lineup is Friday's release of the Federal Reserve's preferred inflation measure, especially after the central bank last week forecast higher-for-longer interest rates. The next inflation reading comes Friday morning with the August personal consumption and expendi |
Why Williams-Sonoma Stock Popped TodayShares of the home furnishings retailer moved higher as some investors confused it with a crypto token. |
Williams-Sonoma Inc (WSM): A Deep Dive into Financial Metrics and Competitive StrengthsUnpacking the Growth and Competitive Edges of Williams-Sonoma Inc (WSM) |
WSM Price Returns
1-mo | 10.38% |
3-mo | 26.47% |
6-mo | 31.05% |
1-year | 26.48% |
3-year | 89.49% |
5-year | 170.30% |
YTD | 39.61% |
2022 | -30.49% |
2021 | 68.60% |
2020 | 42.31% |
2019 | 50.07% |
2018 | 0.61% |
WSM Dividends
Ex-Dividend Date | Type | Payout Amount | Change | ||||||
---|---|---|---|---|---|---|---|---|---|
Loading, please wait... |
Continue Researching WSM
Want to do more research on Williams Sonoma Inc's stock and its price? Try the links below:Williams Sonoma Inc (WSM) Stock Price | Nasdaq
Williams Sonoma Inc (WSM) Stock Quote, History and News - Yahoo Finance
Williams Sonoma Inc (WSM) Stock Price and Basic Information | MarketWatch
Loading social stream, please wait...