Woodward, Inc. (WWD): Price and Financial Metrics
GET POWR RATINGS... FREE!
WWD POWR Grades
- WWD scores best on the Quality dimension, with a Quality rank ahead of 77.99% of US stocks.
- The strongest trend for WWD is in Stability, which has been heading up over the past 177 days.
- WWD's current lowest rank is in the Sentiment metric (where it is better than 13.2% of US stocks).
WWD Stock Summary
- With a price/earnings ratio of 35.95, WOODWARD INC P/E ratio is greater than that of about 80.56% of stocks in our set with positive earnings.
- The price/operating cash flow metric for WOODWARD INC is higher than 86.96% of stocks in our set with a positive cash flow.
- In terms of volatility of its share price, WWD is more volatile than only 14.28% of stocks we're observing.
- Stocks that are quantitatively similar to WWD, based on their financial statements, market capitalization, and price volatility, are ACLS, PHAR, VNDA, JKHY, and THRM.
- Visit WWD's SEC page to see the company's official filings. To visit the company's web site, go to www.woodward.com.
WWD Valuation Summary
- WWD's price/sales ratio is 2.5; this is 13.64% higher than that of the median Industrials stock.
- WWD's EV/EBIT ratio has moved up 22.8 over the prior 243 months.
Below are key valuation metrics over time for WWD.
Stock | Date | P/S | P/B | P/E | EV/EBIT |
---|---|---|---|---|---|
WWD | 2023-02-03 | 2.5 | 3.2 | 36.3 | 30.0 |
WWD | 2023-02-02 | 2.7 | 3.4 | 37.1 | 30.0 |
WWD | 2023-02-01 | 2.6 | 3.3 | 36.6 | 29.6 |
WWD | 2023-01-31 | 2.6 | 3.2 | 35.6 | 28.9 |
WWD | 2023-01-30 | 2.7 | 3.4 | 38.1 | 30.7 |
WWD | 2023-01-27 | 2.8 | 3.5 | 38.5 | 31.1 |
WWD Growth Metrics
- The 2 year revenue growth rate now stands at -23%.
- The 4 year net income to common stockholders growth rate now stands at 39.6%.
- Its 5 year cash and equivalents growth rate is now at 30.27%.

The table below shows WWD's growth in key financial areas (numbers in millions of US dollars).
Date | Revenue | Operating Cash Flow | Net Income to Common Stock |
---|---|---|---|
2022-12-31 | 2,459.823 | 159.75 | 170.999 |
2022-09-30 | 2,382.79 | 193.638 | 171.698 |
2022-06-30 | 2,312.974 | 232.77 | 167.562 |
2022-03-31 | 2,255.317 | 295.78 | 176.977 |
2021-12-31 | 2,249.799 | 357.234 | 197.384 |
2021-09-30 | 2,245.832 | 464.669 | 208.649 |
WWD's Quality Factors
The “Quality” component of the POWR Ratings focuses on 31 different factors of a companies fundamentals and operational strength. Here are some key insights as we drill into the specifics of these quality attributes.- WWD has a Quality Grade of B, ranking ahead of 90.38% of graded US stocks.
- WWD's asset turnover comes in at 0.553 -- ranking 29th of 53 Electrical Equipment stocks.
- CCF, EFOI, and PLUG are the stocks whose asset turnover ratios are most correlated with WWD.
The table below shows WWD's key quality metrics over time.
Period | Asset Turnover | Gross Margin | ROIC |
---|---|---|---|
2021-06-30 | 0.553 | 0.245 | 0.105 |
2021-03-31 | 0.551 | 0.246 | 0.099 |
2020-12-31 | 0.584 | 0.255 | 0.107 |
2020-09-30 | 0.629 | 0.257 | 0.111 |
2020-06-30 | 0.678 | 0.252 | 0.114 |
2020-03-31 | 0.730 | 0.254 | 0.129 |
WWD Price Target
For more insight on analysts targets of WWD, see our WWD price target page. And for a list of of all stocks sorted by upside potential based on analyst target price, see our Top Price Target page.
Average Price Target | $127.71 | Average Broker Recommendation | 1.8 (Moderate Buy) |
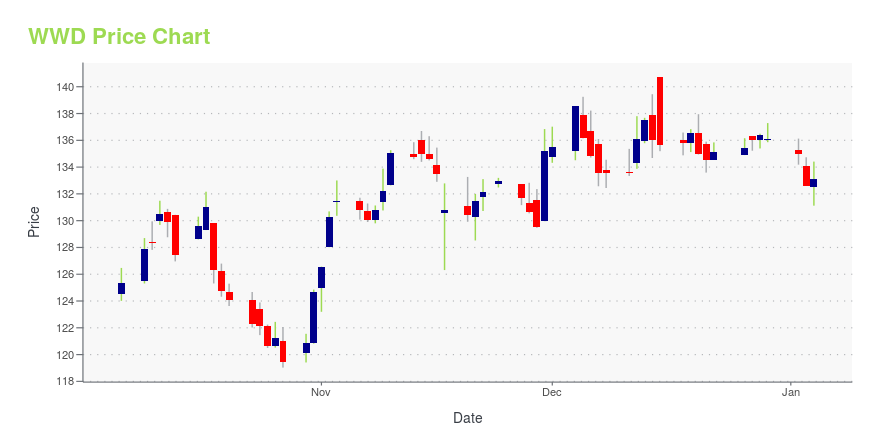
WWD Stock Price Chart Interactive Chart >
WWD Price/Volume Stats
Current price | $102.92 | 52-week high | $129.12 |
Prev. close | $103.84 | 52-week low | $79.26 |
Day low | $102.05 | Volume | 278,800 |
Day high | $104.23 | Avg. volume | 374,025 |
50-day MA | $99.69 | Dividend yield | 0.74% |
200-day MA | $96.46 | Market Cap | 6.15B |
Woodward, Inc. (WWD) Company Bio
Woodward Inc. is an independent designer, manufacturer, and service provider of control system solutions and components for the aerospace and energy markets. The company was founded in 1870 and is based in Fort Collins, Colorado.
Latest WWD News From Around the Web
Below are the latest news stories about WOODWARD INC that investors may wish to consider to help them evaluate WWD as an investment opportunity.
Woodward's (NASDAQ:WWD) Dividend Will Be Increased To $0.22The board of Woodward, Inc. ( NASDAQ:WWD ) has announced that it will be paying its dividend of $0.22 on the 7th of... |
Institutional owners may consider drastic measures as Woodward, Inc.'s (NASDAQ:WWD) recent US$282m drop adds to long-term lossesEvery investor in Woodward, Inc. ( NASDAQ:WWD ) should be aware of the most powerful shareholder groups. And the group... |
Woodward, Inc. (NASDAQ:WWD) Q1 2023 Earnings Call TranscriptWoodward, Inc. (NASDAQ:WWD) Q1 2023 Earnings Call Transcript January 30, 2023 Operator: Thank you for standing by. Welcome to the Woodward, Inc. First Quarter Fiscal Year 2023 Earnings Call. At this time, I’d like to inform you that this call is being recorded for rebroadcast and then all participants are in a listen-only mode. Following […] |
Woodward (WWD) Q1 Earnings Miss Estimates, Revenues Up Y/YWoodward (WWD) first-quarter performance benefits from continued momentum in the Aerospace and Industrial segments, partly offset by unfavorable foreign currency movement. |
In case you missed it, 4 big dividends: UPS, NXPBy Davit Kirakosyan |
WWD Price Returns
1-mo | 0.71% |
3-mo | 8.78% |
6-mo | 2.44% |
1-year | -7.54% |
3-year | -11.78% |
5-year | 28.13% |
YTD | 6.53% |
2022 | -11.09% |
2021 | -9.43% |
2020 | 3.18% |
2019 | 60.41% |
2018 | -2.23% |
WWD Dividends
Ex-Dividend Date | Type | Payout Amount | Change | ||||||
---|---|---|---|---|---|---|---|---|---|
Loading, please wait... |
Continue Researching WWD
Want to see what other sources are saying about Woodward Inc's financials and stock price? Try the links below:Woodward Inc (WWD) Stock Price | Nasdaq
Woodward Inc (WWD) Stock Quote, History and News - Yahoo Finance
Woodward Inc (WWD) Stock Price and Basic Information | MarketWatch
Loading social stream, please wait...