Yum! Brands Inc. (YUM): Price and Financial Metrics
YUM Price/Volume Stats
Current price | $124.34 | 52-week high | $143.24 |
Prev. close | $124.27 | 52-week low | $115.53 |
Day low | $124.17 | Volume | 1,192,943 |
Day high | $125.25 | Avg. volume | 1,579,964 |
50-day MA | $123.41 | Dividend yield | 1.95% |
200-day MA | $130.29 | Market Cap | 34.85B |
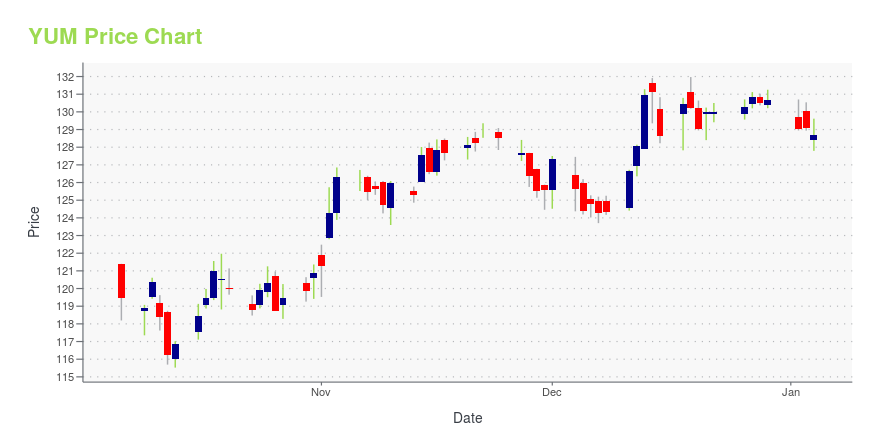
YUM Stock Price Chart Interactive Chart >
YUM POWR Grades
- Quality is the dimension where YUM ranks best; there it ranks ahead of 96.67% of US stocks.
- The strongest trend for YUM is in Growth, which has been heading down over the past 177 days.
- YUM's current lowest rank is in the Value metric (where it is better than 16.5% of US stocks).
YUM Stock Summary
- The capital turnover (annual revenue relative to shareholder's equity) for YUM is -0.86 -- better than just 5.69% of US stocks.
- Of note is the ratio of YUM BRANDS INC's sales and general administrative expense to its total operating expenses; 98.34% of US stocks have a lower such ratio.
- The volatility of YUM BRANDS INC's share price is greater than that of only 4.2% US stocks with at least 200 days of trading history.
- If you're looking for stocks that are quantitatively similar to YUM BRANDS INC, a group of peers worth examining would be MLM, VMC, WY, STZ, and AME.
- YUM's SEC filings can be seen here. And to visit YUM BRANDS INC's official web site, go to www.yum.com.
YUM Valuation Summary
- In comparison to the median Consumer Cyclical stock, YUM's price/sales ratio is 628.57% higher, now standing at 5.1.
- Over the past 243 months, YUM's EV/EBIT ratio has gone up 8.3.
Below are key valuation metrics over time for YUM.
Stock | Date | P/S | P/B | P/E | EV/EBIT |
---|---|---|---|---|---|
YUM | 2023-12-01 | 5.1 | -4.4 | 23.7 | 20.3 |
YUM | 2023-11-30 | 5.0 | -4.3 | 23.4 | 20.0 |
YUM | 2023-11-29 | 5.0 | -4.3 | 23.4 | 20.0 |
YUM | 2023-11-28 | 5.0 | -4.3 | 23.5 | 20.1 |
YUM | 2023-11-27 | 5.1 | -4.4 | 23.8 | 20.3 |
YUM | 2023-11-24 | 5.1 | -4.4 | 23.9 | 20.4 |
YUM Growth Metrics
- Its 2 year revenue growth rate is now at 18.53%.
- Its year over year net income to common stockholders growth rate is now at 43.68%.
- The 3 year net cashflow from operations growth rate now stands at 27.04%.

The table below shows YUM's growth in key financial areas (numbers in millions of US dollars).
Date | Revenue | Operating Cash Flow | Net Income to Common Stock |
---|---|---|---|
2022-09-30 | 6,713 | 1,389 | 1,284 |
2022-06-30 | 6,679 | 1,455 | 1,481 |
2022-03-31 | 6,645 | 1,635 | 1,648 |
2021-12-31 | 6,584 | 1,706 | 1,575 |
2021-09-30 | 6,437 | 1,744 | 1,577 |
2021-06-30 | 6,279 | 1,716 | 1,332 |
YUM's Quality Factors
The “Quality” component of the POWR Ratings focuses on 31 different factors of a companies fundamentals and operational strength. Here are some key insights as we drill into the specifics of these quality attributes.- YUM has a Quality Grade of A, ranking ahead of 96.55% of graded US stocks.
- YUM's asset turnover comes in at 1.087 -- ranking 13th of 79 Restaraunts Hotels Motels stocks.
- TNL, QSR, and EAT are the stocks whose asset turnover ratios are most correlated with YUM.
The table below shows YUM's key quality metrics over time.
Period | Asset Turnover | Gross Margin | ROIC |
---|---|---|---|
2021-06-30 | 1.087 | 0.487 | 0.155 |
2021-03-31 | 0.984 | 0.480 | 0.139 |
2020-12-31 | 0.926 | 0.475 | 0.113 |
2020-09-30 | 0.942 | 0.481 | 0.117 |
2020-06-30 | 0.966 | 0.483 | 0.114 |
2020-03-31 | 1.068 | 0.495 | 0.126 |
YUM Price Target
For more insight on analysts targets of YUM, see our YUM price target page. And for a list of of all stocks sorted by upside potential based on analyst target price, see our Top Price Target page.
Average Price Target | $134.64 | Average Broker Recommendation | 1.79 (Moderate Buy) |
Yum! Brands Inc. (YUM) Company Bio
Yum! Brands, Inc. (or Yum!), formerly Tricon Global Restaurants, Inc., is an American fast food corporation listed on the Fortune 1000. Yum! operates the brands KFC, Pizza Hut, Taco Bell, The Habit Burger Grill, and WingStreet worldwide, except in China, where the brands are operated by a separate company, Yum China. KFC and Taco Bell are operated by Collins Foods Limited in Australia, Germany, the Netherlands, Thailand and Japan. Yum! previously also owned Long John Silver's and A&W Restaurants. (Source:Wikipedia)
Latest YUM News From Around the Web
Below are the latest news stories about YUM BRANDS INC that investors may wish to consider to help them evaluate YUM as an investment opportunity.
Why Is Yum (YUM) Up 1% Since Last Earnings Report?Yum (YUM) reported earnings 30 days ago. What's next for the stock? We take a look at earnings estimates for some clues. |
Yum! Brands Reskilling Academy Apprentice: Truman W.NORTHAMPTON, MA / ACCESSWIRE / November 30, 2023 / Yum! BrandsOriginally published by Taco BellThis year, Taco Bell extended Digital & Technology apprenticeships to some of its restaurant team members. Called the Yum! Reskilling Academy (YRA), this ... |
$2.4 Million in Grants To Support Sagebrush Ecosystems in the Intermountain West Announced by NFWFEight grants awarded through the Rocky Mountain Rangelands Program will improve sagebrush rangelands, big game migration corridors and wet meadow habitatsNORTHAMPTON, MA / ACCESSWIRE / November 28, 2023 / Yum! BrandsSustainability is more than just ... |
Pizza Hut Canada is Giving Away $1 Million Worth of Pizzas with an Epic Repizza EventIn a move as bold as its flavours, Pizza Hut Canada is giving away more than $1 million in free pizzas —yes, you read that right, that's over 50,000 FREE pizzas — with its Repizza campaign on December 4, available for one day only! |
Yum! Brands Reskilling Academy Apprentice: Toby C.NORTHAMPTON, MA / ACCESSWIRE / November 27, 2023 / Yum! BrandsOriginally published by Taco BellThis year, Taco Bell extended Digital & Technology apprenticeships to some of its restaurant team members. Called the Yum! Reskilling Academy (YRA), this ... |
YUM Price Returns
1-mo | -0.54% |
3-mo | -1.27% |
6-mo | -5.94% |
1-year | -2.44% |
3-year | 24.85% |
5-year | 50.44% |
YTD | -1.09% |
2022 | -5.99% |
2021 | 30.05% |
2020 | 9.85% |
2019 | 11.41% |
2018 | 14.61% |
YUM Dividends
Ex-Dividend Date | Type | Payout Amount | Change | ||||||
---|---|---|---|---|---|---|---|---|---|
Loading, please wait... |
Continue Researching YUM
Want to see what other sources are saying about Yum Brands Inc's financials and stock price? Try the links below:Yum Brands Inc (YUM) Stock Price | Nasdaq
Yum Brands Inc (YUM) Stock Quote, History and News - Yahoo Finance
Yum Brands Inc (YUM) Stock Price and Basic Information | MarketWatch
Loading social stream, please wait...