
Yum China Holdings Inc. (YUMC): Price and Financial Metrics
YUMC Price/Volume Stats
| Current price | $30.01 | 52-week high | $61.99 |
| Prev. close | $29.24 | 52-week low | $29.02 |
| Day low | $29.42 | Volume | 2,161,100 |
| Day high | $30.19 | Avg. volume | 3,119,840 |
| 50-day MA | $33.31 | Dividend yield | 2.14% |
| 200-day MA | $39.53 | Market Cap | 11.69B |
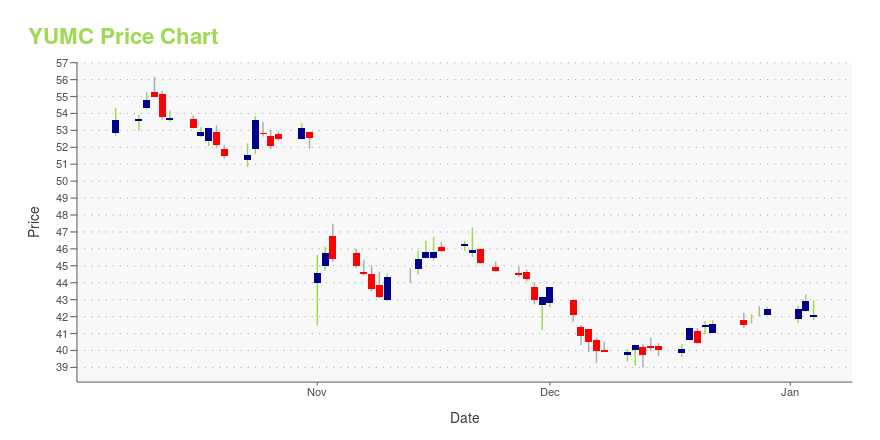
YUMC Stock Price Chart Interactive Chart >
Yum China Holdings Inc. (YUMC) Company Bio
Yum China Holdings, Inc. (Chinese: 百胜中国; pinyin: Bǎishèng Zhōngguó) is a Chinese Fortune 500 fast-food restaurant company based in Shanghai, China. With US$9.5 billion in revenue and 10,600 restaurants worldwide it is one of the largest restaurant companies. It was spun off from Yum! Brands in 2016, becoming an independent, publicly traded company on November 1, 2016. Yum China is a trademark licensee of Yum Brands, paying 3% of total systemwide sales to Yum Brands. It operates 8,484 restaurants in over 1,100 cities located in every province and autonomous region in Mainland China. It has a workforce of 450,000 employees. Since the stock is listed on the New York Stock Exchange, the company has an office in Plano, Texas for SEC filings. (Source:Wikipedia)
Latest YUMC News From Around the Web
Below are the latest news stories about YUM CHINA HOLDINGS INC that investors may wish to consider to help them evaluate YUMC as an investment opportunity.
Yum China (YUMC) Down 25% in a Year: What's Hurting the Stock?Yum China (YUMC) anticipates high inflation and lower consumer confidence to act as a headwind. It expects inflationary pressures to persist throughout 2023. |
The Anti-Bubble: 3 Underdog Stocks Ready to Pop Once Sentiment FlipsForget the outgoing year’s flavors of the week if you want to see sizable growth in your portfolio; instead, go the contrarian route and consider so-called underdog stocks. |
Analyst Favorites: 3 Newly Rated ‘Buy’ Stocks to Consider NowThe top analyst stock picks heading into 2024 include these three names that analysts have recently initiated coverage with a "Buy". |
Asian Market Mavericks: 7 Stocks Defining the Future of Asia’s EconomyNavigating Asia's financial boom. |
Yum China Leads the Restaurant & Leisure Industry for the Fourth Consecutive Year on the Dow Jones Sustainability IndexYum China Holdings, Inc. (the "Company" or "Yum China", NYSE: YUMC and HKEX: 9987) today announced that the Company has been ranked number one globally for the Restaurant & Leisure Facilities Industry in the S&P Global 2023 Corporate Sustainability Assessment (CSA). For the fourth consecutive year, Yum China has been selected as a member of both the Dow Jones Sustainability Indices (DJSI): World Index (DJSI World) and Emerging Market Index (DJSI Emerging Markets). It reflects the Company's unwav |
YUMC Price Returns
| 1-mo | -4.73% |
| 3-mo | -23.97% |
| 6-mo | -14.76% |
| 1-year | -48.56% |
| 3-year | -49.40% |
| 5-year | -30.61% |
| YTD | -28.68% |
| 2023 | -21.60% |
| 2022 | 10.75% |
| 2021 | -11.99% |
| 2020 | 19.48% |
| 2019 | 44.85% |
YUMC Dividends
| Ex-Dividend Date | Type | Payout Amount | Change | ||||||
|---|---|---|---|---|---|---|---|---|---|
| Loading, please wait... | |||||||||
Continue Researching YUMC
Want to do more research on Yum China Holdings Inc's stock and its price? Try the links below:Yum China Holdings Inc (YUMC) Stock Price | Nasdaq
Yum China Holdings Inc (YUMC) Stock Quote, History and News - Yahoo Finance
Yum China Holdings Inc (YUMC) Stock Price and Basic Information | MarketWatch
Loading social stream, please wait...