Goldman Sachs Group Inc. (GS): Price and Financial Metrics
GET POWR RATINGS... FREE!
GS Price/Volume Stats
Current price | $332.01 | 52-week high | $389.58 |
Prev. close | $323.88 | 52-week low | $277.84 |
Day low | $324.00 | Volume | 2,718,600 |
Day high | $332.87 | Avg. volume | 2,622,636 |
50-day MA | $326.72 | Dividend yield | 3.09% |
200-day MA | $341.37 | Market Cap | 110.38B |
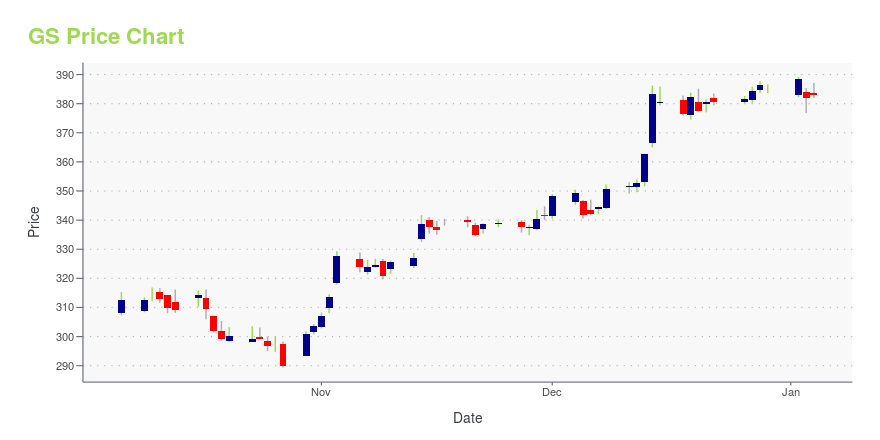
GS Stock Price Chart Interactive Chart >
GS POWR Grades
- Momentum is the dimension where GS ranks best; there it ranks ahead of 91.64% of US stocks.
- The strongest trend for GS is in Stability, which has been heading down over the past 179 days.
- GS's current lowest rank is in the Sentiment metric (where it is better than 32.4% of US stocks).
GS Stock Summary
- GS has a higher market value than 98.05% of US stocks; more precisely, its current market capitalization is $106,320,221,424.
- For GS, its debt to operating expenses ratio is greater than that reported by 97.29% of US equities we're observing.
- Equity multiplier, or assets relative to shareholders' equity, comes in at 13.01 for GOLDMAN SACHS GROUP INC; that's greater than it is for 94.52% of US stocks.
- Stocks with similar financial metrics, market capitalization, and price volatility to GOLDMAN SACHS GROUP INC are C, SCHW, HDB, MUFG, and MS.
- GS's SEC filings can be seen here. And to visit GOLDMAN SACHS GROUP INC's official web site, go to www.goldmansachs.com.
GS Valuation Summary
- In comparison to the median Financial Services stock, GS's EV/EBIT ratio is 362.96% higher, now standing at 50.
- Over the past 243 months, GS's price/sales ratio has gone down 0.2.
Below are key valuation metrics over time for GS.
Stock | Date | P/S | P/B | P/E | EV/EBIT |
---|---|---|---|---|---|
GS | 2023-05-19 | 2.3 | 0.9 | 10.8 | 50.0 |
GS | 2023-05-18 | 2.3 | 0.9 | 10.9 | 50.1 |
GS | 2023-05-17 | 2.4 | 0.9 | 11.0 | 50.1 |
GS | 2023-05-16 | 2.3 | 0.9 | 10.6 | 49.8 |
GS | 2023-05-15 | 2.3 | 0.9 | 10.7 | 49.9 |
GS | 2023-05-12 | 2.3 | 0.9 | 10.6 | 49.8 |
GS Growth Metrics
- Its 3 year net cashflow from operations growth rate is now at 28.67%.
- The year over year revenue growth rate now stands at 1.96%.
- The 4 year revenue growth rate now stands at 12.96%.

The table below shows GS's growth in key financial areas (numbers in millions of US dollars).
Date | Revenue | Operating Cash Flow | Net Income to Common Stock |
---|---|---|---|
2022-12-31 | 47,365 | 8,708 | 10,764 |
2022-09-30 | 49,411 | 48,602 | 13,388 |
2022-06-30 | 51,044 | 1,159 | 15,710 |
2022-03-31 | 54,568 | -16,848 | 18,271 |
2021-12-31 | 59,339 | 921 | 21,151 |
2021-09-30 | 58,441 | -7,962 | 21,704 |
GS's Quality Factors
The “Quality” component of the POWR Ratings focuses on 31 different factors of a companies fundamentals and operational strength. Here are some key insights as we drill into the specifics of these quality attributes.- GS has a Quality Grade of C, ranking ahead of 47.43% of graded US stocks.
- GS's asset turnover comes in at 0.045 -- ranking 304th of 442 Trading stocks.
- JHG, GROW, and WY are the stocks whose asset turnover ratios are most correlated with GS.
The table below shows GS's key quality metrics over time.
Period | Asset Turnover | Gross Margin | ROIC |
---|---|---|---|
2021-06-30 | 0.045 | 1 | 0.015 |
2021-03-31 | 0.045 | 1 | 0.012 |
2020-12-31 | 0.039 | 1 | 0.008 |
2020-09-30 | 0.039 | 1 | 0.006 |
2020-06-30 | 0.038 | 1 | 0.005 |
2020-03-31 | 0.036 | 1 | 0.006 |
GS Price Target
For more insight on analysts targets of GS, see our GS price target page. And for a list of of all stocks sorted by upside potential based on analyst target price, see our Top Price Target page.
Average Price Target | $426.18 | Average Broker Recommendation | 1.61 (Moderate Buy) |
Goldman Sachs Group Inc. (GS) Company Bio
Goldman Sachs operates as an investment banking, securities, and investment management company worldwide. The company operates through four segments: Investment Banking, Institutional Client Services, Investing & Lending, and Investment Management. The company was founded in 1869 and is based in New York, New York.
Latest GS News From Around the Web
Below are the latest news stories about GOLDMAN SACHS GROUP INC that investors may wish to consider to help them evaluate GS as an investment opportunity.
3 Short-Squeeze Candidates That Could Skyrocket in MayThese short-squeeze stocks could return explosive gains as their businesses recover while their short-interest ratios remain elevated. |
Biden, McCarthy Set 5:30 PM White House Debt Limit Meeting(Bloomberg) -- President Joe Biden and Republican House Speaker Kevin McCarthy will meet at 5:30 pm Monday at the White House for talks on averting a catastrophic US default as time runs short and key differences remain.Most Read from BloombergChina’s $23 Trillion Local Debt Mess Is About to Get WorseMexico Raises Alert Level on Volcano Rumbling Near CapitalMeta Fined Record €1.2 Billion in EU Over US Data TransfersMessi, Ronaldo Lead Saudi Arabia's Multibillion-Dollar MakeoverAhead of the meeti |
Goldman Sachs to Pay $215M in Settlements After Underpaying WomenNot only does that translate into lower savings account balances, but it can also mean lower retirement plan balances -- and less long-term financial security. Goldman Sachs has agreed to pay $215 million to settle a long-standing class action lawsuit that accused the bank of underpaying women. Not only will Goldman Sachs be paying the employees it wronged, but it's also pledged to hire an independent expert to conduct an analysis on its performance evaluation processes, as well as its processes for promotions. |
Gorman’s Tenure at Morgan Stanley a Tough Act to FollowSucceeding a star chief executive can always be tough. In the case of Morgan Stanley it could be doubly so. In the wake of his announcement Friday that he will retire as chief executive within the year, James Gorman has rightly received plaudits for his highly successful tenure at the Wall Street institution. |
Goldman Sachs Group (NYSE:GS) Is Increasing Its Dividend To $2.50The Goldman Sachs Group, Inc.'s ( NYSE:GS ) dividend will be increasing from last year's payment of the same period to... |
GS Price Returns
1-mo | -3.33% |
3-mo | -4.91% |
6-mo | -13.40% |
1-year | 3.84% |
3-year | 79.79% |
5-year | 60.46% |
YTD | -2.62% |
2022 | -7.87% |
2021 | 47.61% |
2020 | 17.45% |
2019 | 40.48% |
2018 | -33.53% |
GS Dividends
Ex-Dividend Date | Type | Payout Amount | Change | ||||||
---|---|---|---|---|---|---|---|---|---|
Loading, please wait... |
Continue Researching GS
Want to do more research on Goldman Sachs Group Inc's stock and its price? Try the links below:Goldman Sachs Group Inc (GS) Stock Price | Nasdaq
Goldman Sachs Group Inc (GS) Stock Quote, History and News - Yahoo Finance
Goldman Sachs Group Inc (GS) Stock Price and Basic Information | MarketWatch
Loading social stream, please wait...