
Target Corporation (TGT): Price and Financial Metrics
TGT Price/Volume Stats
| Current price | $149.00 | 52-week high | $181.86 |
| Prev. close | $146.29 | 52-week low | $102.93 |
| Day low | $147.25 | Volume | 2,426,961 |
| Day high | $149.99 | Avg. volume | 3,850,742 |
| 50-day MA | $148.89 | Dividend yield | 2.93% |
| 200-day MA | $145.41 | Market Cap | 68.93B |
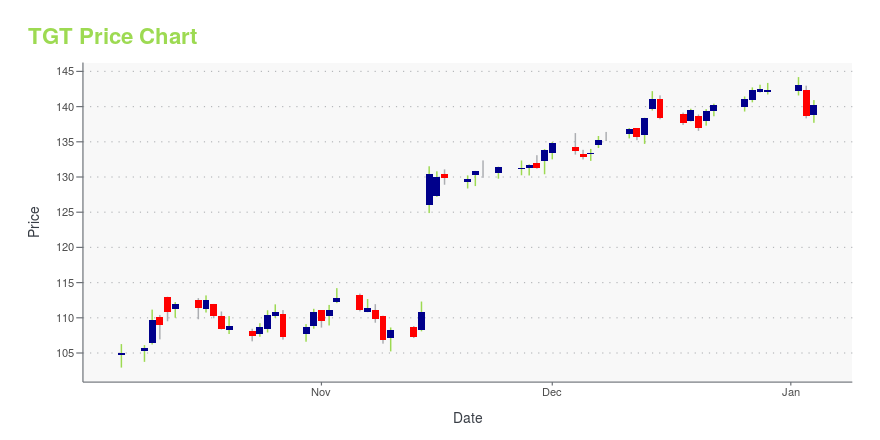
TGT Stock Price Chart Interactive Chart >
Target Corporation (TGT) Company Bio
Target Corporation operates as a general merchandise retailer in the United States and Canada, offering offering a selection of merchandise, including consumables, seasonal, home products and apparel. The company was founded in 1902 and is based in Minneapolis, Minnesota.
Latest TGT News From Around the Web
Below are the latest news stories about TARGET CORP that investors may wish to consider to help them evaluate TGT as an investment opportunity.
The 500 Top Stocks to Buy for 2024, Ranked by AIThese are the very best stocks to buy for 2024 for any investor, according to Tom Yeung's MarketMasterAI system. |
Beyond Meat founder and CEO: The arc of history is on our sideIt's not easy to change a well-entrenched industry, something Yahoo Finance was reminded of when sitting down with Beyond Meat's founder and CEO Ethan Brown. |
Beyond Meat: How the plant-based CEO leads an uphill battleEthan Brown is one of the leaders taking on the meat industry, as Founder and CEO of Beyond Meat (BYND). Brown has managed to make deals with brands like Target (TGT) and Dunkin Donuts, and in May of 2019 he took the company public as part of the plant-based meat boom. Brown invited Yahoo Finance Executive Editor Brian Sozzi to Beyond Meat headquarters in El Segundo, CA to share insights on what it takes to lead the company through the challenges of competing in the meat industry and the qualities that keep him going, like building a trustworthy team, focusing on the company’s true mission of changing how consumers consume meat, and embracing failure along the way. “We have to figure out how to get people comfortable with quick iteration, quick failure, and then quick recovery,” says Br... |
3 Incredibly Cheap Dividend StocksHere are dividend-paying stocks that are trading at a discount and merit a look from income investors. |
Taking Off? 3 Top Drone Maker Stock Picks for 2024With drones so ubiquitous in the military, the sector is becoming quite lucrative. |
TGT Price Returns
| 1-mo | 1.24% |
| 3-mo | -8.93% |
| 6-mo | 6.04% |
| 1-year | 15.43% |
| 3-year | -37.00% |
| 5-year | 94.68% |
| YTD | 6.98% |
| 2023 | -1.35% |
| 2022 | -33.81% |
| 2021 | 32.91% |
| 2020 | 40.47% |
| 2019 | 100.17% |
TGT Dividends
| Ex-Dividend Date | Type | Payout Amount | Change | ||||||
|---|---|---|---|---|---|---|---|---|---|
| Loading, please wait... | |||||||||
Continue Researching TGT
Want to do more research on Target Corp's stock and its price? Try the links below:Target Corp (TGT) Stock Price | Nasdaq
Target Corp (TGT) Stock Quote, History and News - Yahoo Finance
Target Corp (TGT) Stock Price and Basic Information | MarketWatch
Loading social stream, please wait...